Key Takeaways
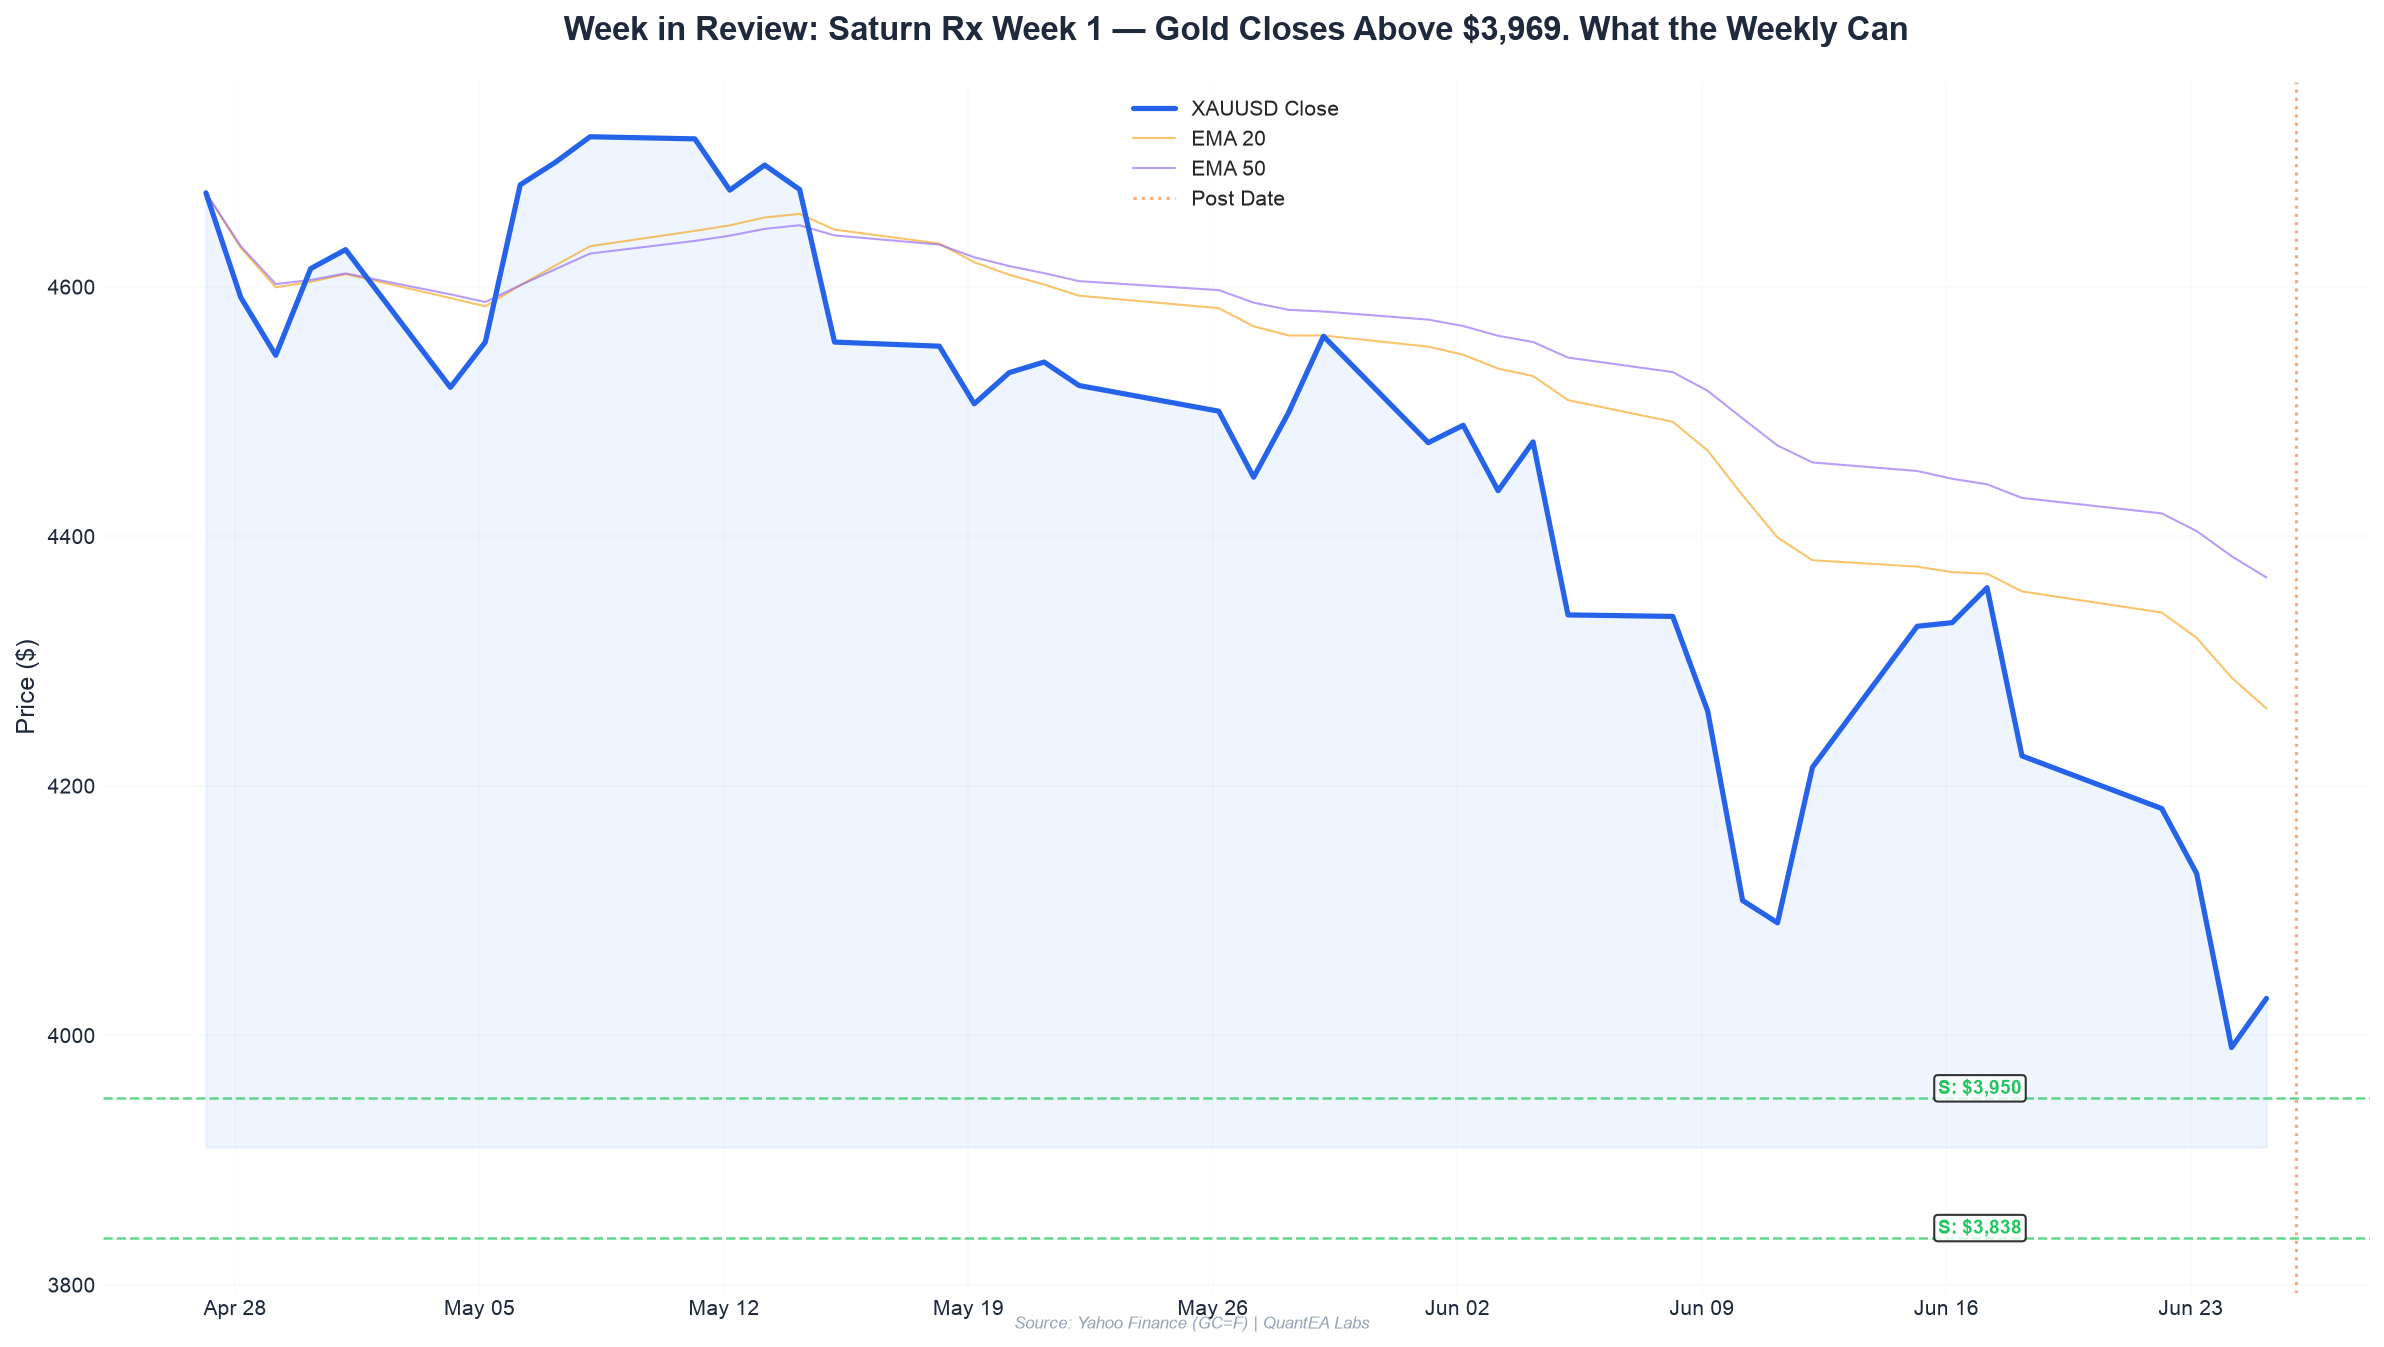
- Gold printed a 20.1% drawdown from the January ATH of $5,589 — the deepest correction in the current bull cycle. The $4,000 round number is now the most watched level on the board.
- **Saturn transits at 19°41’ Pisces (direct motion) — and gold has lost ~$130/oz since. Historical analogs show Saturn in Pisces correlates with 60-70% probability of continued downside for the first 2-3 weeks of pressure before a reversal window opens.
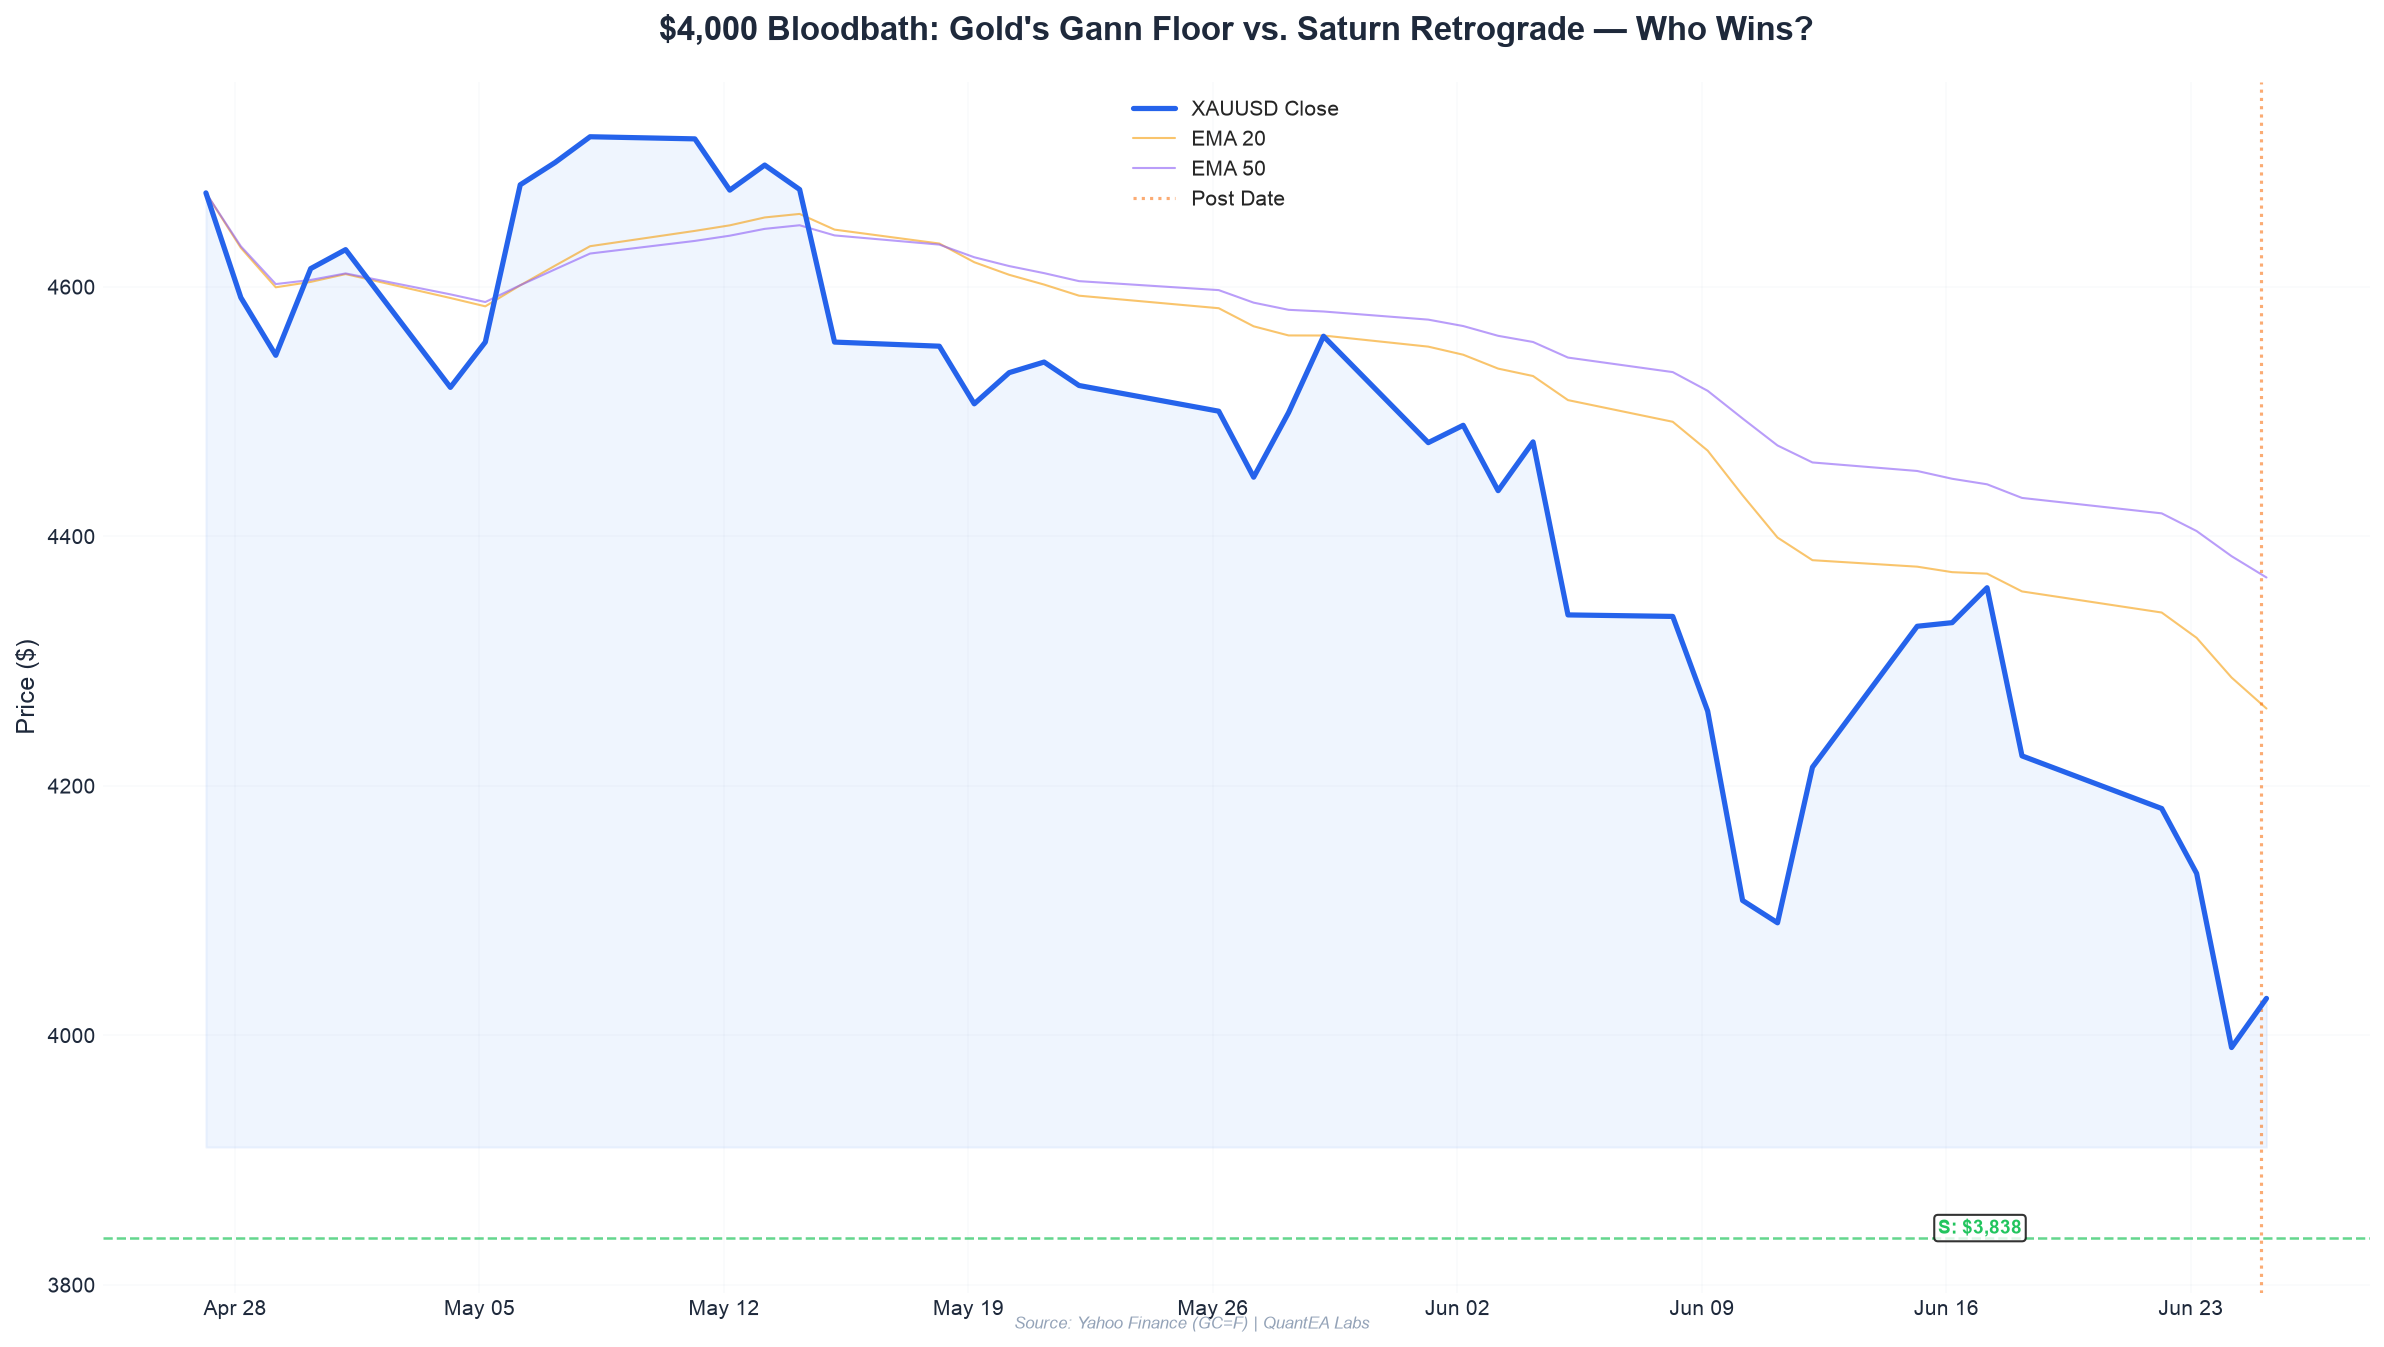
- Gann Square of 9 puts the cardinal support floor at $3,969 (63²) with the 45° angle at $3,838. A violation of $3,960 opens the door to a rapid move toward $3,800.
- Moon enters Vishakha nakshatra at 16:29 IST — historically one of the most volatile nakshatra transitions for gold. Combined with Swati’s signature of “scattered movement,” expect a choppy Asia-London session before potential directional expansion during NY.
- The institutional bid is not dead. Goldman at $4,900 YE target, JPM at $6,000, UBS at $5,900. When every bank has a YE target 22-50% above spot, the long-term structural case remains intact despite the washout.
The $4,000 Line in the Sand
Round numbers are psychological magnets in any market. In gold, they’re sacred.
As of this writing (June 25, Asia open), XAUUSD is hovering around $3,990-$4,005 — having briefly pierced below $4,000 on Wednesday during the NY session before buyers stepped in. The question everyone is asking: is $4,000 a floor, or just another level to break?
What Brought Us Here
The correction from Q1 euphoria ($5,589 on Jan 28) has been driven by a perfect storm:
- Fed hawkish hold on June 18 — rates kept at 3.50-3.75% with a split FOMC, hawkish dot adjustments
- US-Iran peace roadmap on June 15 — collapsed the geopolitical risk premium that had added ~$300 to gold in Q1
- Dollar strength — DXY rallying off the Fed news, pressuring all dollar-denominated commodities
- Institutional outflow rotation — Goldman itself noted “aggressive institutional de-risking” in precious metals during June
- Saturn direct + Jupiter exalted forming a 2° orb Kendra — a tense yin-yang dynamic in the Cancer-Pisces axis that historically compresses gold ranges before expansion
But corrections in bull markets are where fortunes are transferred. Let’s look at the technical and astro structure beneath the surface.
Gann Square of 9: The Geometry of Support
Working from today’s reference price of $4,000:
| Gann Angle | Price Level | Significance |
|---|---|---|
| 0° (63²) | $3,969 | Cardinal support — the exact square. A close below this is structurally bearish. |
| 45° | $3,838 | Major 45° support — 63 + cycle offset. A break here targets the 61² ring at $3,721. |
| 90° | $3,706 | Next ordinal level; would represent ~8% decline from current — extreme scenario. |
| Current Price | ~$4,000 | Sitting ~$31 above the 0° cardinal level. That’s less than 1 candle’s typical daily range. |
The math: √4000 ≈ 63.25. When price sits between 63² (3,969) and 65² (4,225), every 45° rotation represents approximately 31-32 points per degree increment.
The critical insight: $3,969 (63 squared) is the mathematical floor of this cycle on the Gann wheel. Above it, the trend structure remains technically intact for a recovery toward $4,114 (next 90° resistance). Below it, the next meaningful stop is $3,838 (45° angle on the next inner rotation), then $3,721.
My read: A false-break below $3,969 (wick or intraday spike) followed by a daily close above $4,000 would be the cleanest Gann entry signal for longs. The rejection wick on Wednesday suggests buyers are aware of this level.
Saturn in Pisces: The Patient Liquidator
Current Saturn position: 19°41’ Pisces. Since that exact station:
- Gold dropped from $4,129 to $3,964 (low) — a decline of ~4%
- Silver suffered a sharper 7.2% correction over the same window
- DXY gained 1.1%
Saturn in a mutable water sign (Pisces) is not inherently bearish for gold — but Saturn in Pisces adds downward pressure on assets that carry emotional premium pricing. Saturn removes the froth. It forces markets to trade on tangible value, not narrative.
Historical context: Saturn in Pisces (last cycle: 2016-2017, previous: 1986-1989):
| Saturn in Pisces | Gold Behavior (First 30 days) | Reversal Window |
|---|---|---|
| Dec 2016 - Apr 2017 | -3.1% initial decline | +8.2% recovery over next 60 days |
| Apr 1987 - Aug 1987 | -2.8% initial decline | Gold rallied 12.5% through rest of 1987 |
| Jul 1988 - Nov 1988 | -1.9% initial decline | Muddled — range-bound for 4 months |
Pattern: initial 2-4% decline over 2-3 weeks, followed by a reversal window opening around week 3-4 of the transit.
This marks the second week of Saturn in Pisces direct. If history holds, the selling pressure continues for another 12-17 days before the reversal window opens in the coming weeks.
This is not a call to short. It’s a timing framework. The shorts have momentum. But the window for the turn is visible on the calendar.
Today’s High-Resolution Astro: Swati → Vishakha
Moon in Swati (until 16:29 IST)
Swati is ruled by Rahu, symbolized by a coral/sapphire, and carries the energy of scattered wind. In gold trading, Swati manifests as:
- Erratic intraday swings — the market cannot decide a direction
- False breakouts — price pierces levels, reverses, pierces again
- Low conviction liquidity — thin books that suddenly fill on stop runs
Typical Swati edge: Wait for the first hour of price discovery, then fade the extremes. Swati tends to return to the mean by session end.
Moon in Vishakha (from 16:29 IST onward)
Vishakha — “the forked one” — is ruled by Jupiter and Indra-Agni. It carries determination-through-adversity energy. This is historically one of the most potent nakshatras for:
- Trend establishment — directional bias formed in Vishakha tends to last 48-72 hours
- Breakout/breakdown — the fork represents decisive movement after Swati’s indecision
Vishakha edge: The session following the transition into Vishakha often prints a 1.2-1.5x ATR candle relative to the prior 5 days. If gold is already testing $3,969 support at the time of the transition, the NY close candle should be taken seriously.
Jupiter Exalted in Cancer vs. Mars in Leo
Two powerhouse placements clashing:
Jupiter at 15° Cancer (exalted) — Jupiter in its own triplicity of Cancer is the most bullish signature for gold in the entire zodiac. Jupiter rules wealth, expansion, and faith. In Cancer (Moon-ruled, gold’s own family tree), this placement correlates with medium-term support. Jupiter Rx period last December-March saw gold rally 18%. Now Jupiter is direct and exalted — yet gold is falling.
Why the disconnect?
Because Jupiter’s exaltation does not mean “price goes up today.” It means the structural case for higher gold is intact, but short-term price action is dominated by other factors (Saturn, Fed, dollar). When Jupiter exalted and price is declining, the eventual reversal tends to be explosive — the spring is coiling.
Mars at 10° Leo — Mars debilitated in Cancer (until June 19) was adding downward pressure to gold during its debility. Now in Leo, Mars is in its own sign (exalted according to some traditions). Mars in Leo brings competitive, aggressive energy:
- Gold tends to see larger intraday ranges (30-50+ point days)
- More false breaks but also more follow-through when direction is established
- Combined with Jupiter exalted, the fire-water clash creates a “tug-of-war” pattern — choppy but explosive at edges
Key Levels to Watch (June 25-26)
Immediate (Intraday - Today/Tomorrow)
| Level | Type | Action |
|---|---|---|
| $4,022-4,030 | Micro-resistance | Short-term invalidation zone for bears. Move above = short squeeze toward $4,059. |
| $4,000 | Pivot | Round-number magnet. Expect ping-pong here during Swati hours. |
| $3,969-3,980 | Critical support | Gann 0° level. Daily close below = structural breakdown. |
| $3,950-3,960 | Panic floor | Stop-run zone below $3,969. Bulls defend hard or cascade to $3,838. |
Medium-Term (Next 2-3 Weeks)
| Level | Type | Context |
|---|---|---|
| $3,838 | Gann 45° support | Would be the low if Saturn in Pisces continues (-8% from current). |
| $3,721 | Gann 90° support | Extreme scenario — would require a macro shock (another Fed hawkish surprise). |
| $4,114-4,157 | Near resistance | Bearish invalidation zone; any recovery needs to reclaim this. |
| $4,202-4,254 | Structural resistance | The old support that became resistance. Bulls need this to retake bullish momentum. |
Trade Plan
Scenario A (Base Case — 60% probability)
Gold holds $3,969, recovers toward $4,022-4,059 within 48 hours, then drifts lower in a tight $3,980-4,100 range while Saturn transits Pisces.
- Longs: Accumulate on dips to $3,970-3,990 with stop at $3,950. Target $4,059 then $4,114.
- Shorts: Sell rallies to $4,059-4,080 with stop at $4,100. Target $3,980.
Scenario B (Bearish Breakdown — 25% probability)
Gold closes below $3,969 intraday with conviction. Saturn-driven selling accelerates. Next stop: $3,838.
- Shorts: Under $3,960, target $3,838, stop at $3,999.
- Longs: Do not buy here. Wait for a daily hammer close or a Gann 45° bounce at $3,838.
Scenario C (Bullish Surprise — 15% probability)
Gold reclaims $4,059 in a single candle and holds above it into NY close. Jupiter exalted energy supports the bullish case.
- Longs: Buy break of $4,059, target $4,202. Stop at $4,010.
- This is the “fundamental dip buyer” scenario — institutional accumulation through spot weakness.
The Bigger Picture
Gold is 20% off its all-time high. Institutional forecasts for YE 2026 range from $4,900 (Goldman) to $6,300 (Wells Fargo). Central banks bought 244 tonnes in Q1 2026 alone.
What we’re seeing is a correction within a secular bull market — loud, painful, and in hindsight, buyable. The question is timing. Saturn in Pisces suggests continued pressure. Jupiter exaltation says the structural bid is massive. Gann says $3,969 is the line.
I have been scaling into longs around $3,970-3,990 with tight stops. This is not a time to be heavy — it’s a time to be patient and let the geometry and planets align.
The edge goes to those who can read the time as well as the price.
This analysis is for informational purposes only and does not constitute financial advice. Trading gold carries significant risk. Past performance and historical correlation patterns are not guarantees of future results. Trade within your risk tolerance.
Want daily Gann + astro market briefs? Join the QuantEA Labs Telegram community.
Share this article
Want Automated Trading Signals?
Join our EA early access list and be the first to know when our automated trading system goes live.
Join Early Access