Trading Insights
Astro-quant analysis, market research, and trading education
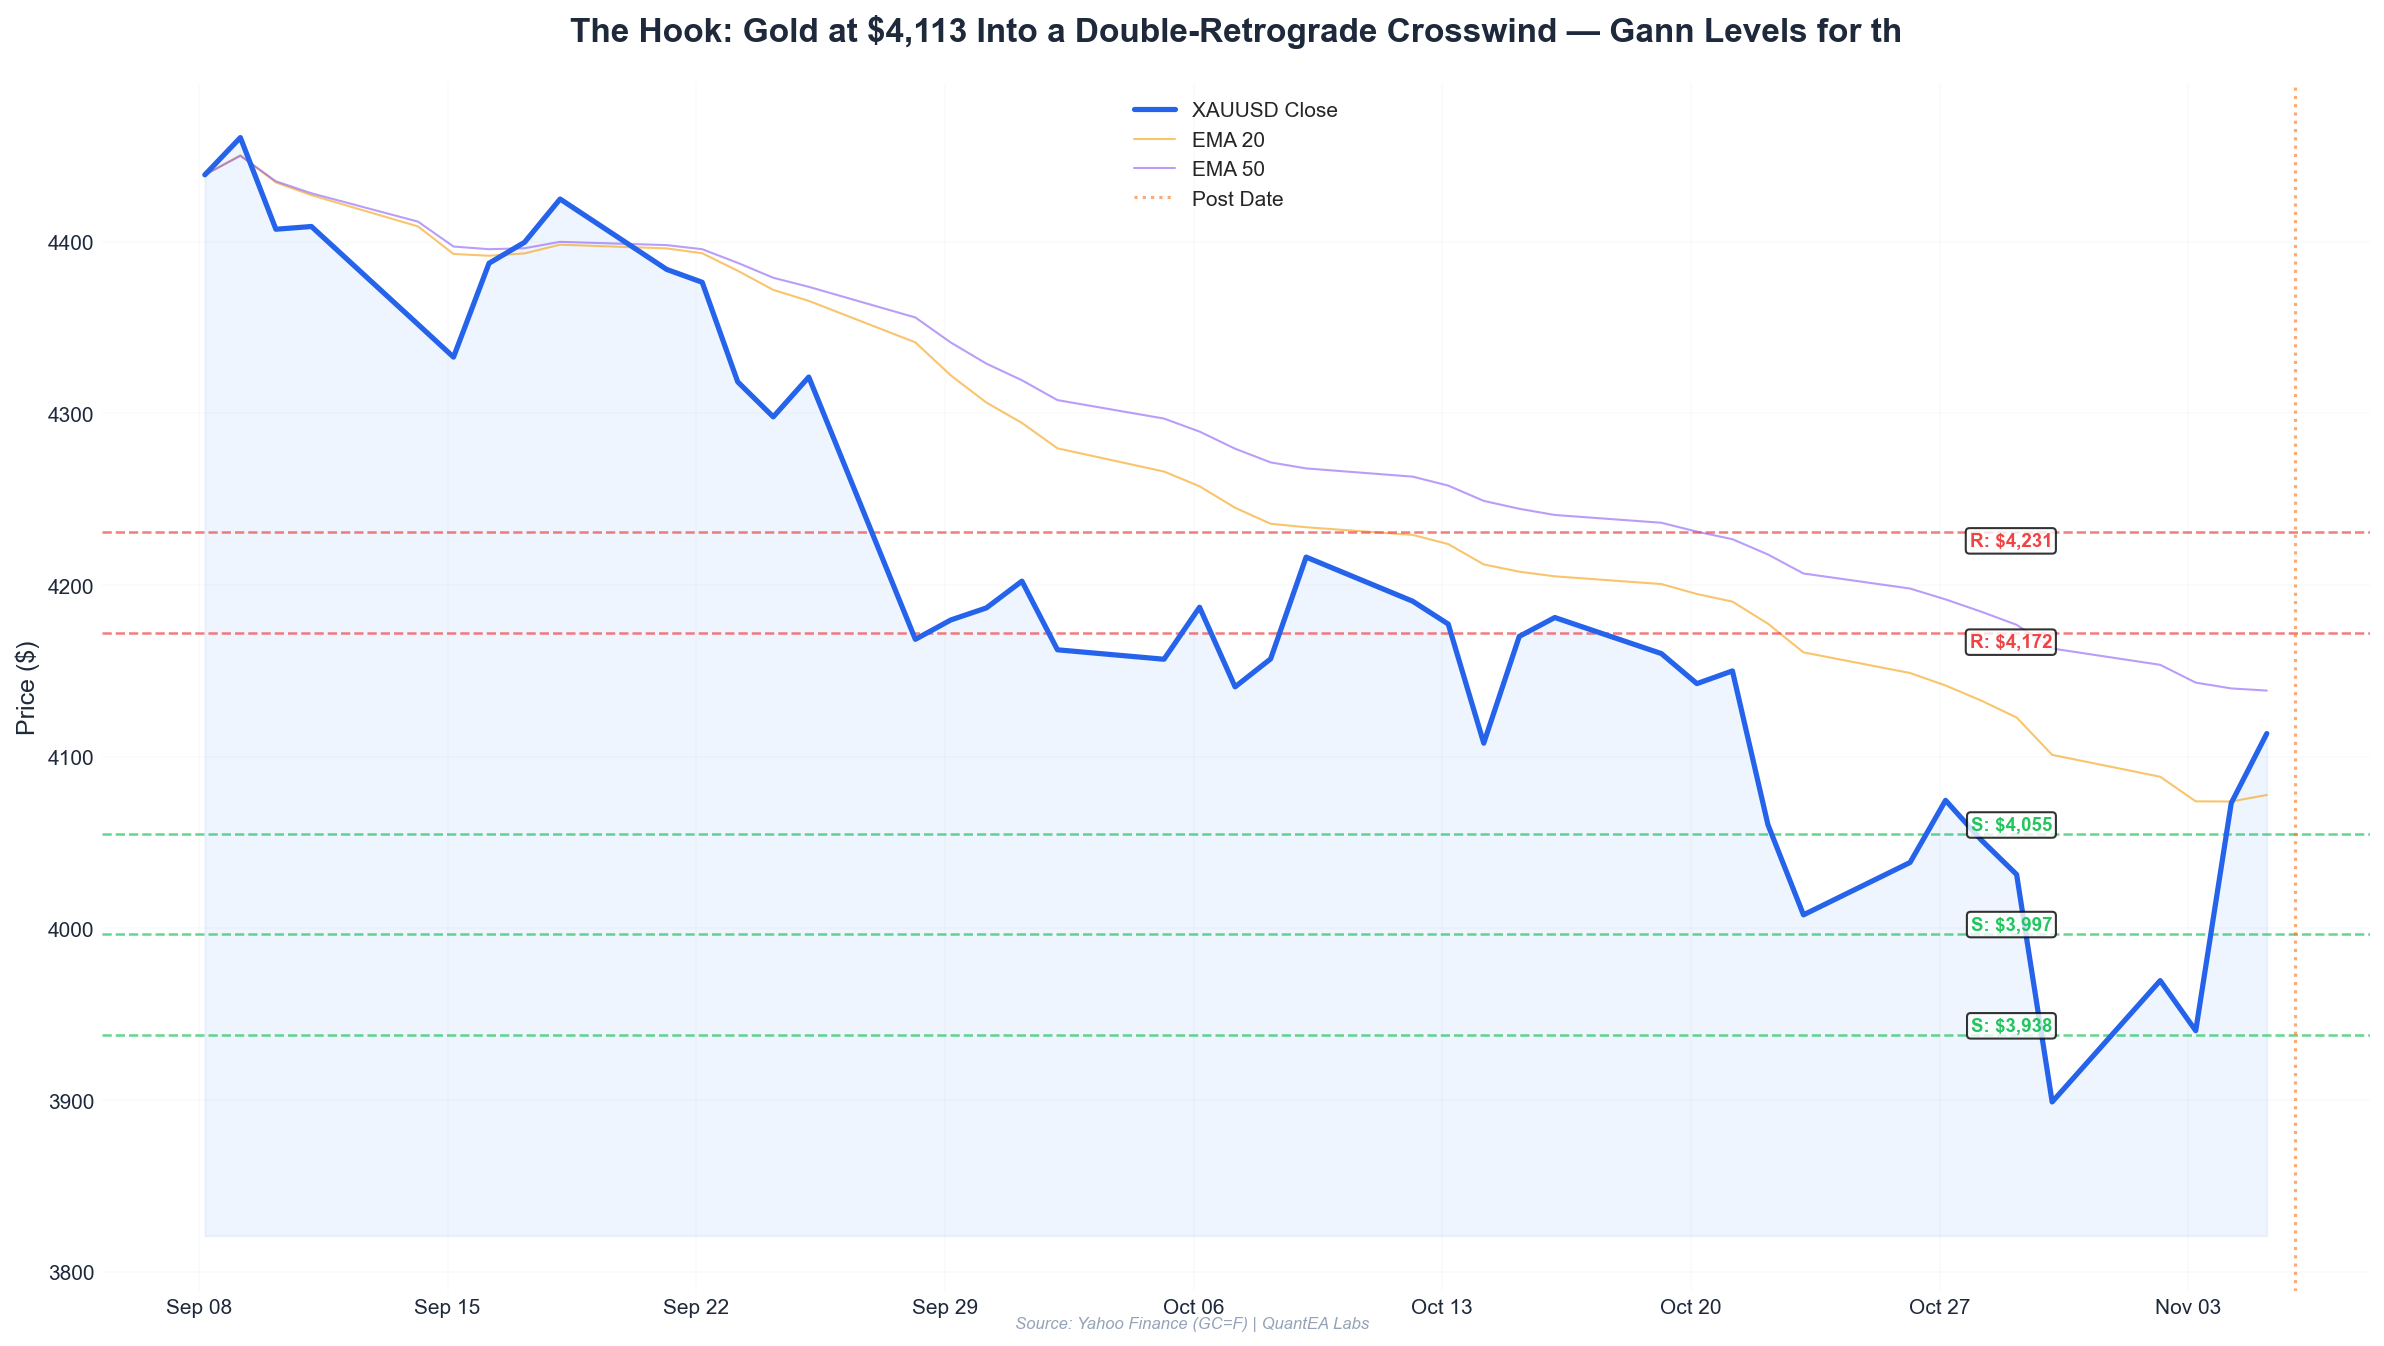
The Hook: Gold at $4,113 Into a Double-Retrograde Crosswind — Gann Levels for the Week of November 9, 2026
Gold closed a wild week at $4,113.50. With Mercury and Venus both retrograde, Saturn retrograde in Pisces, and Ketu conjunct Jupiter in Leo, here are the Gann Square of 9 levels and Moon-sign windows that matter next week.
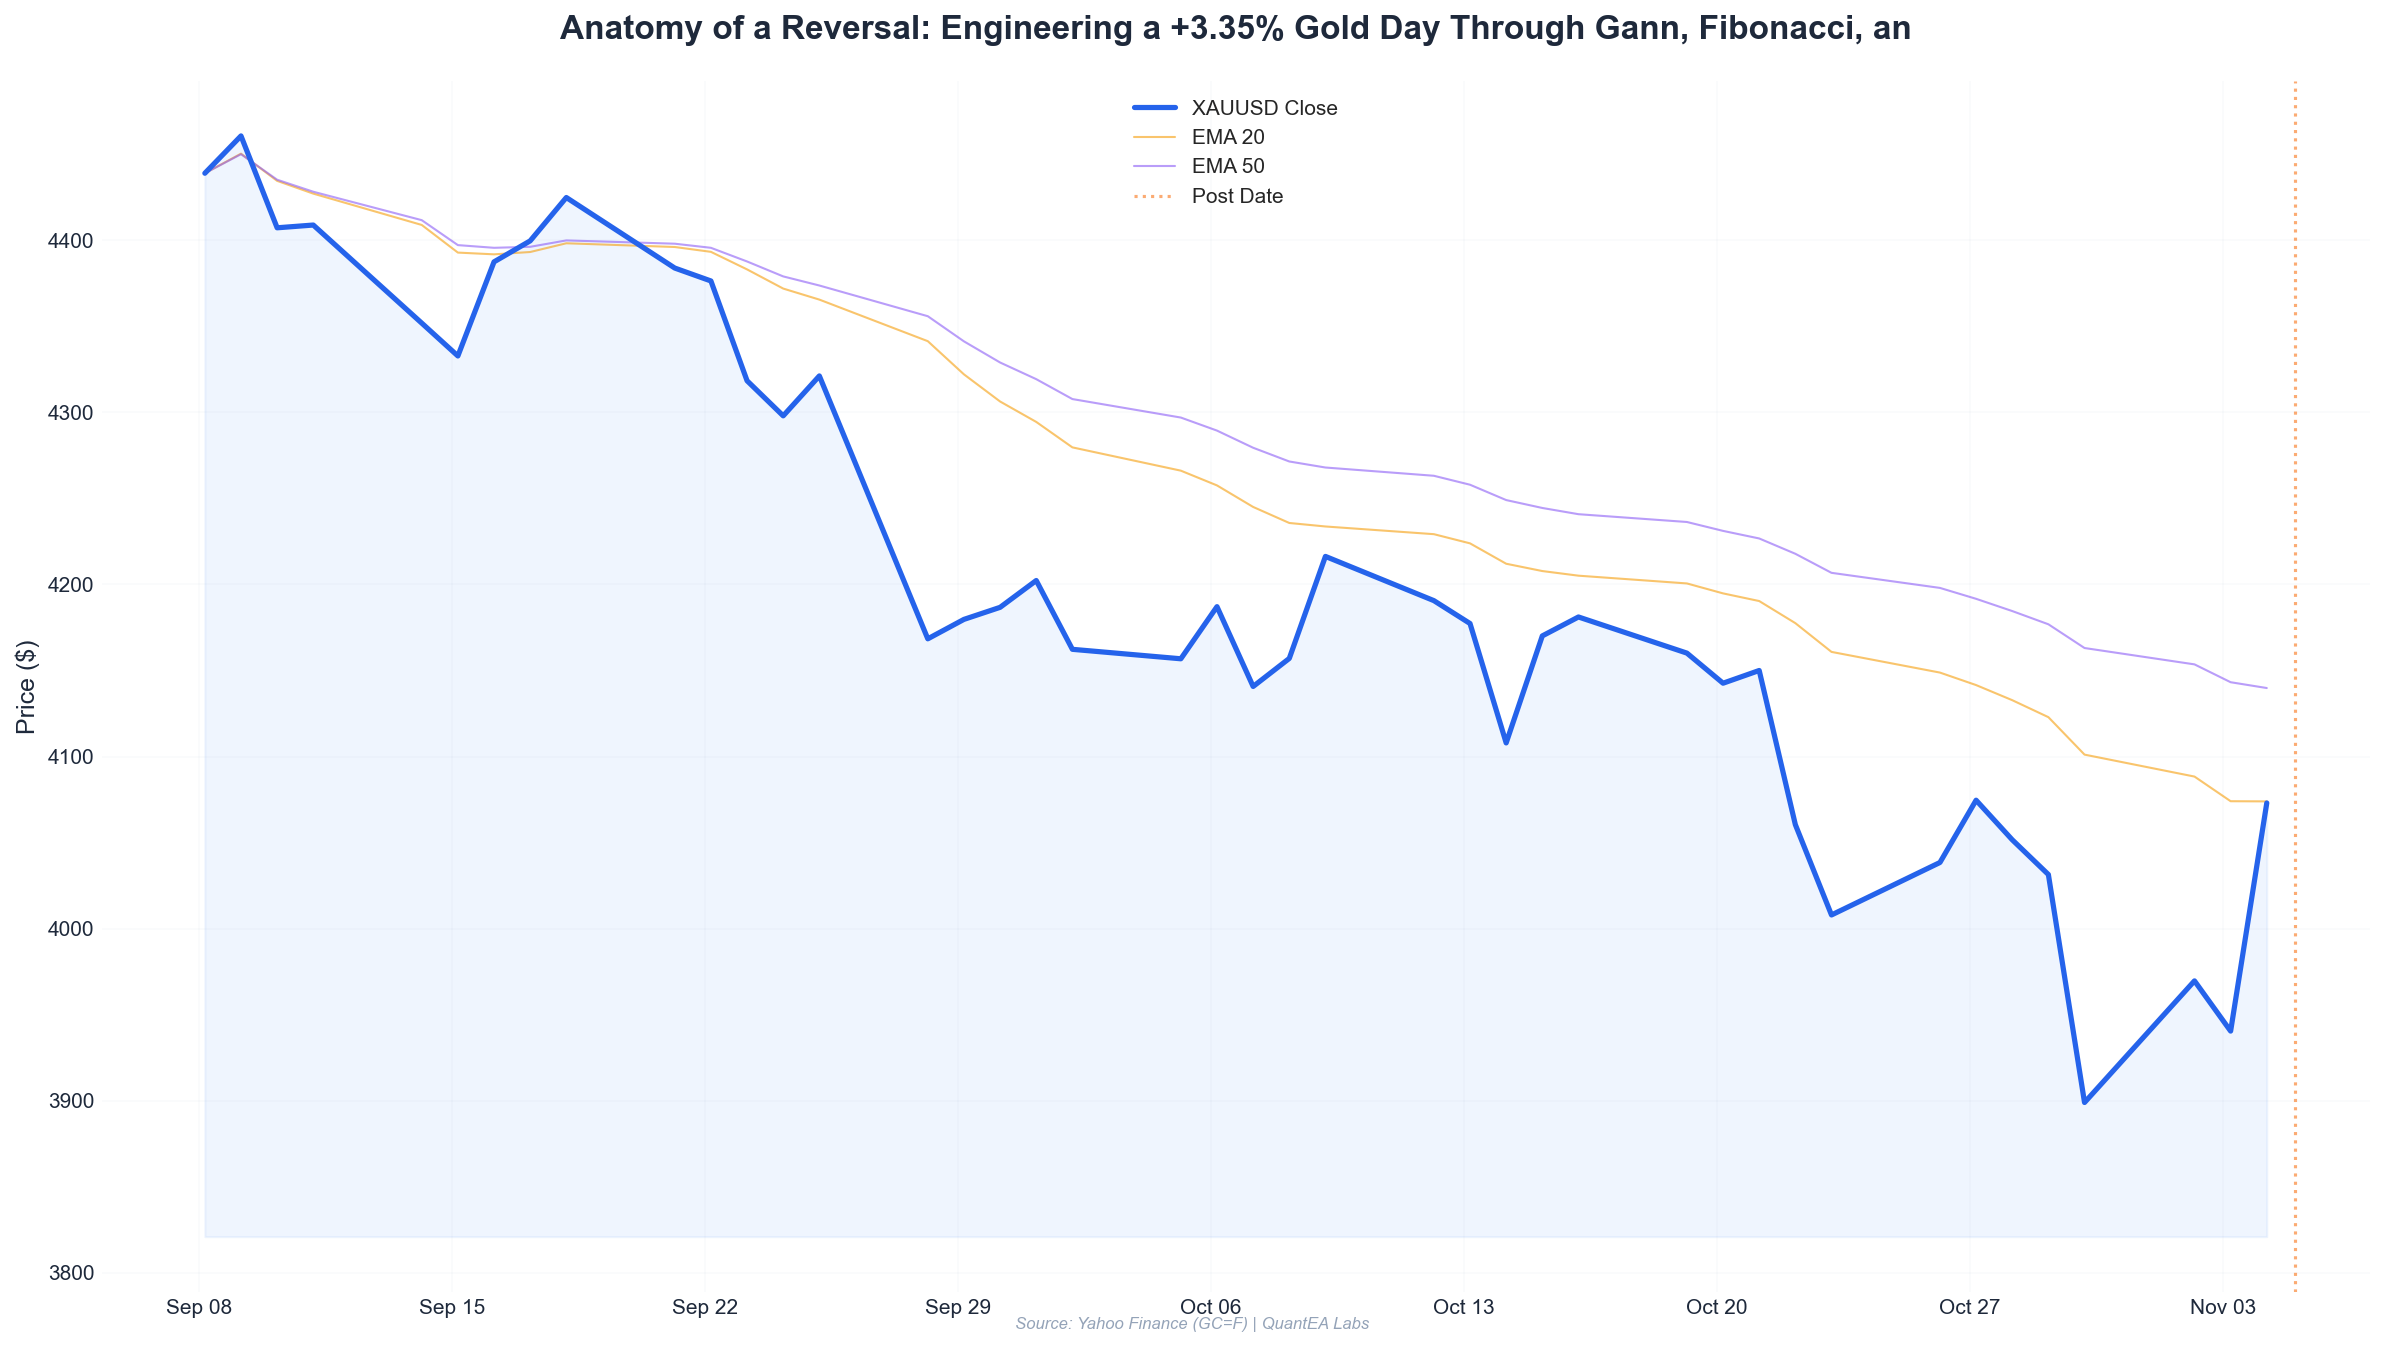
Anatomy of a Reversal: Engineering a +3.35% Gold Day Through Gann, Fibonacci, and a Ketu-Ruled Moon
A full trade breakdown of the Nov 4, 2026 gold reversal — Gann Square of 9 levels, sidereal transits, and the 2% position-sizing math behind a 1:3.6 R:R.
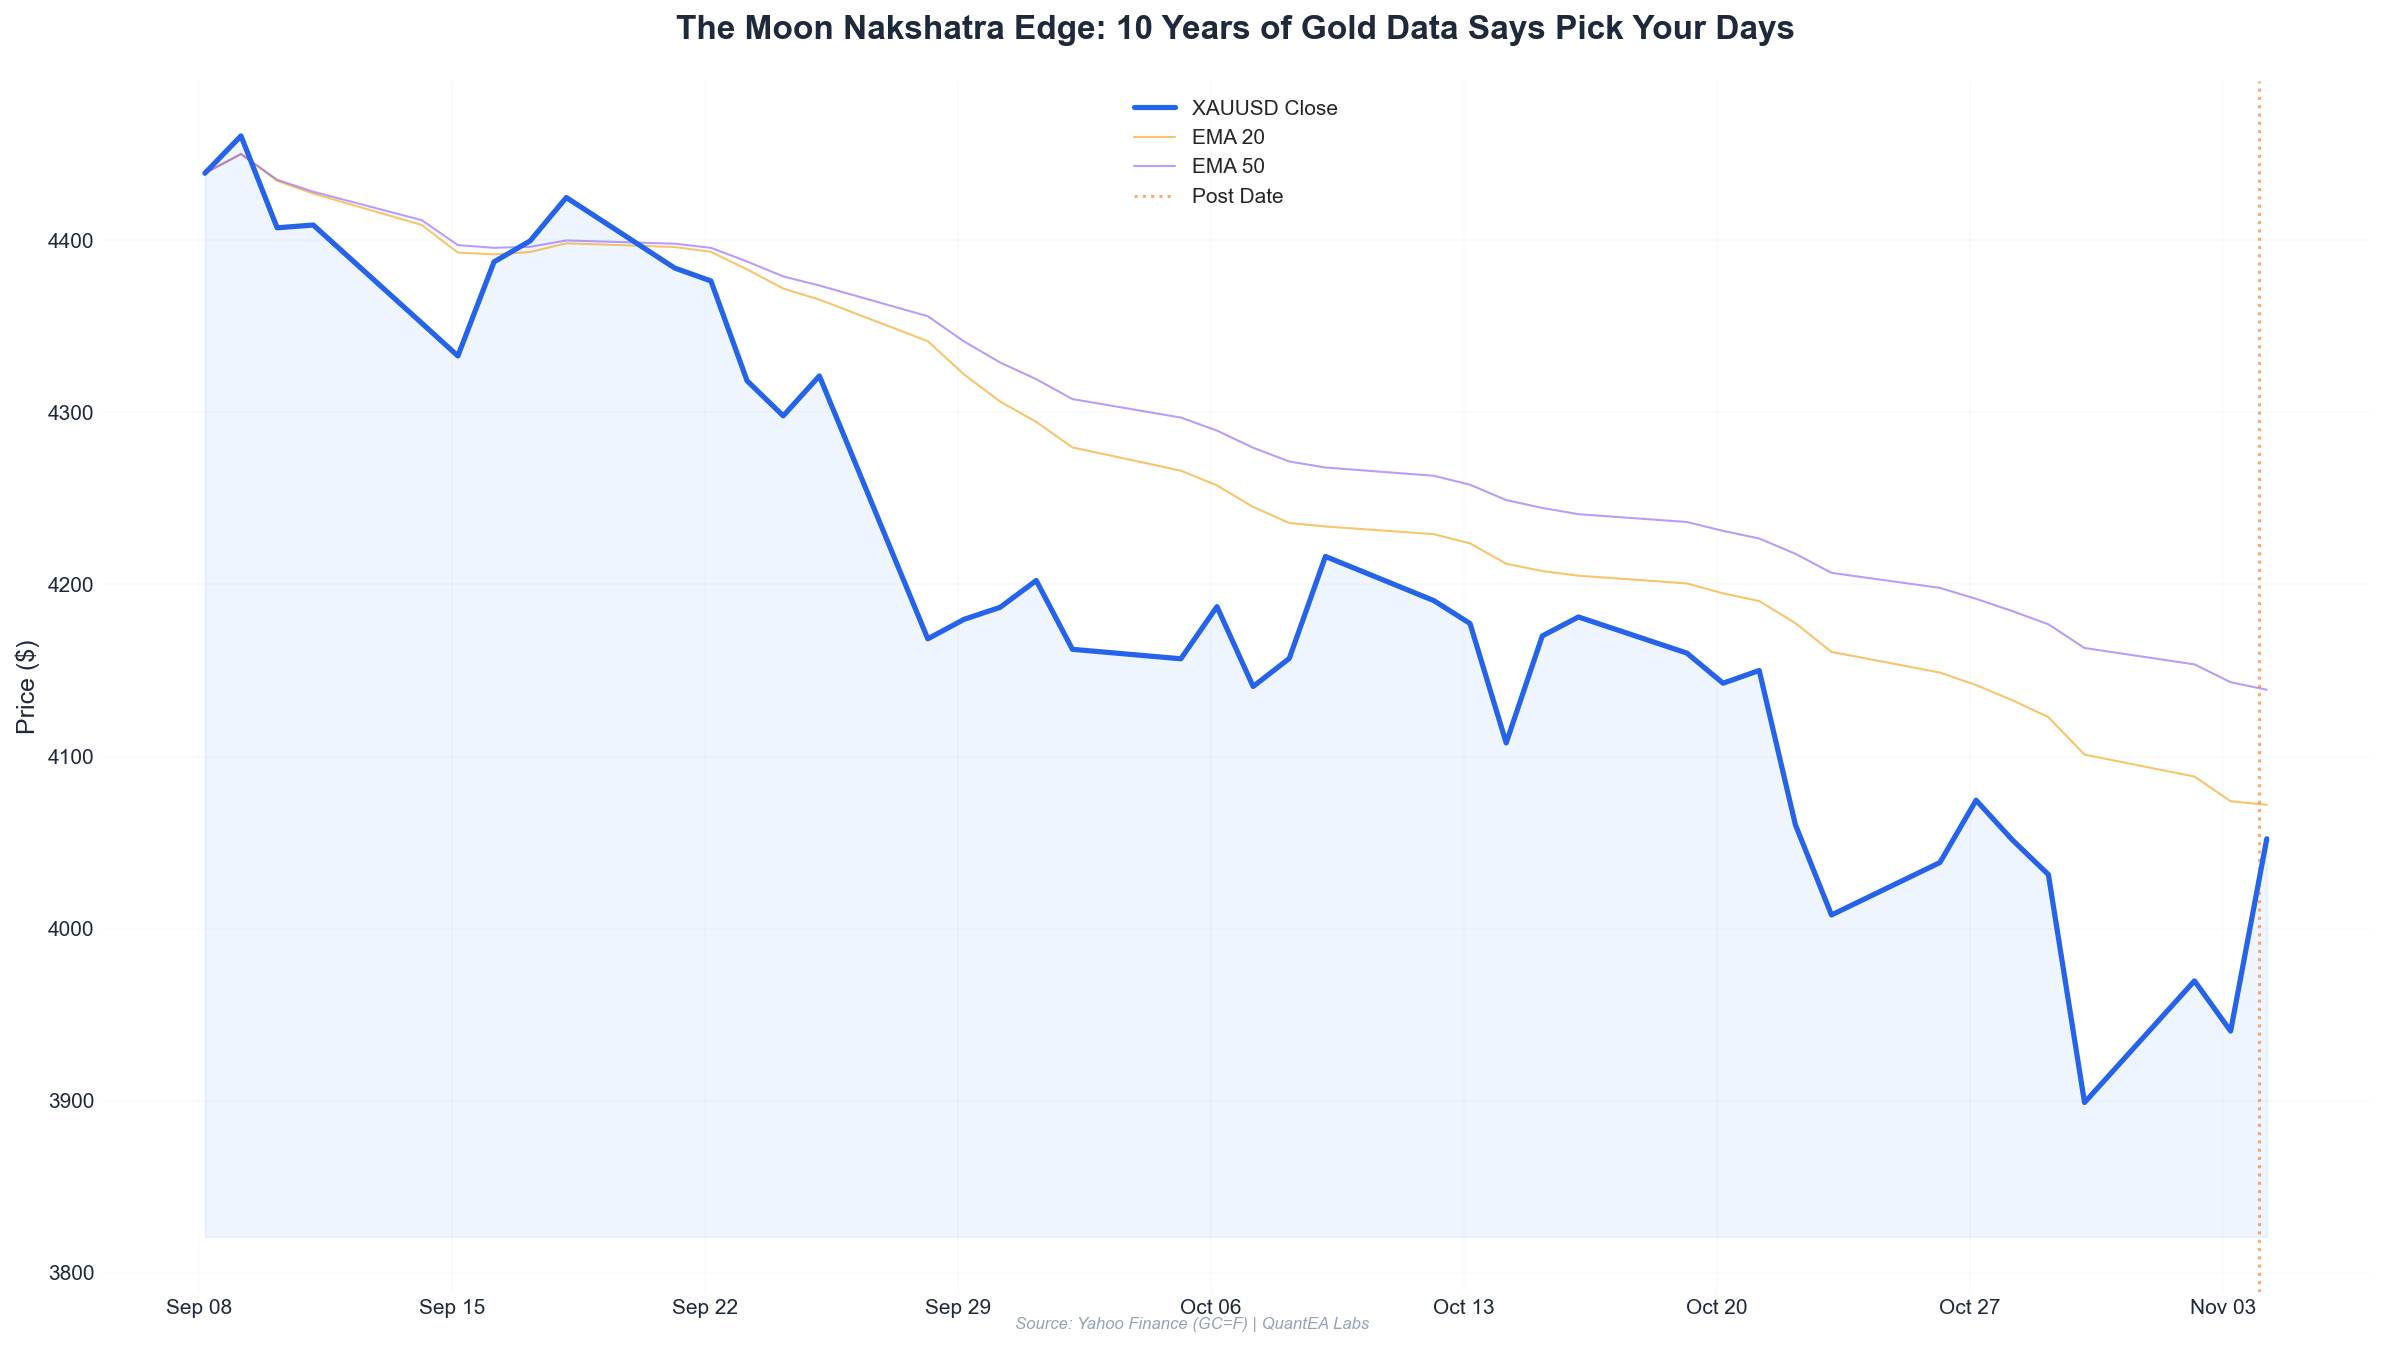
The Moon Nakshatra Edge: 10 Years of Gold Data Says Pick Your Days
2,500+ trading days of gold data reveal which 27 Moon nakshatras actually carry edge — and which popular ones are statistical noise.
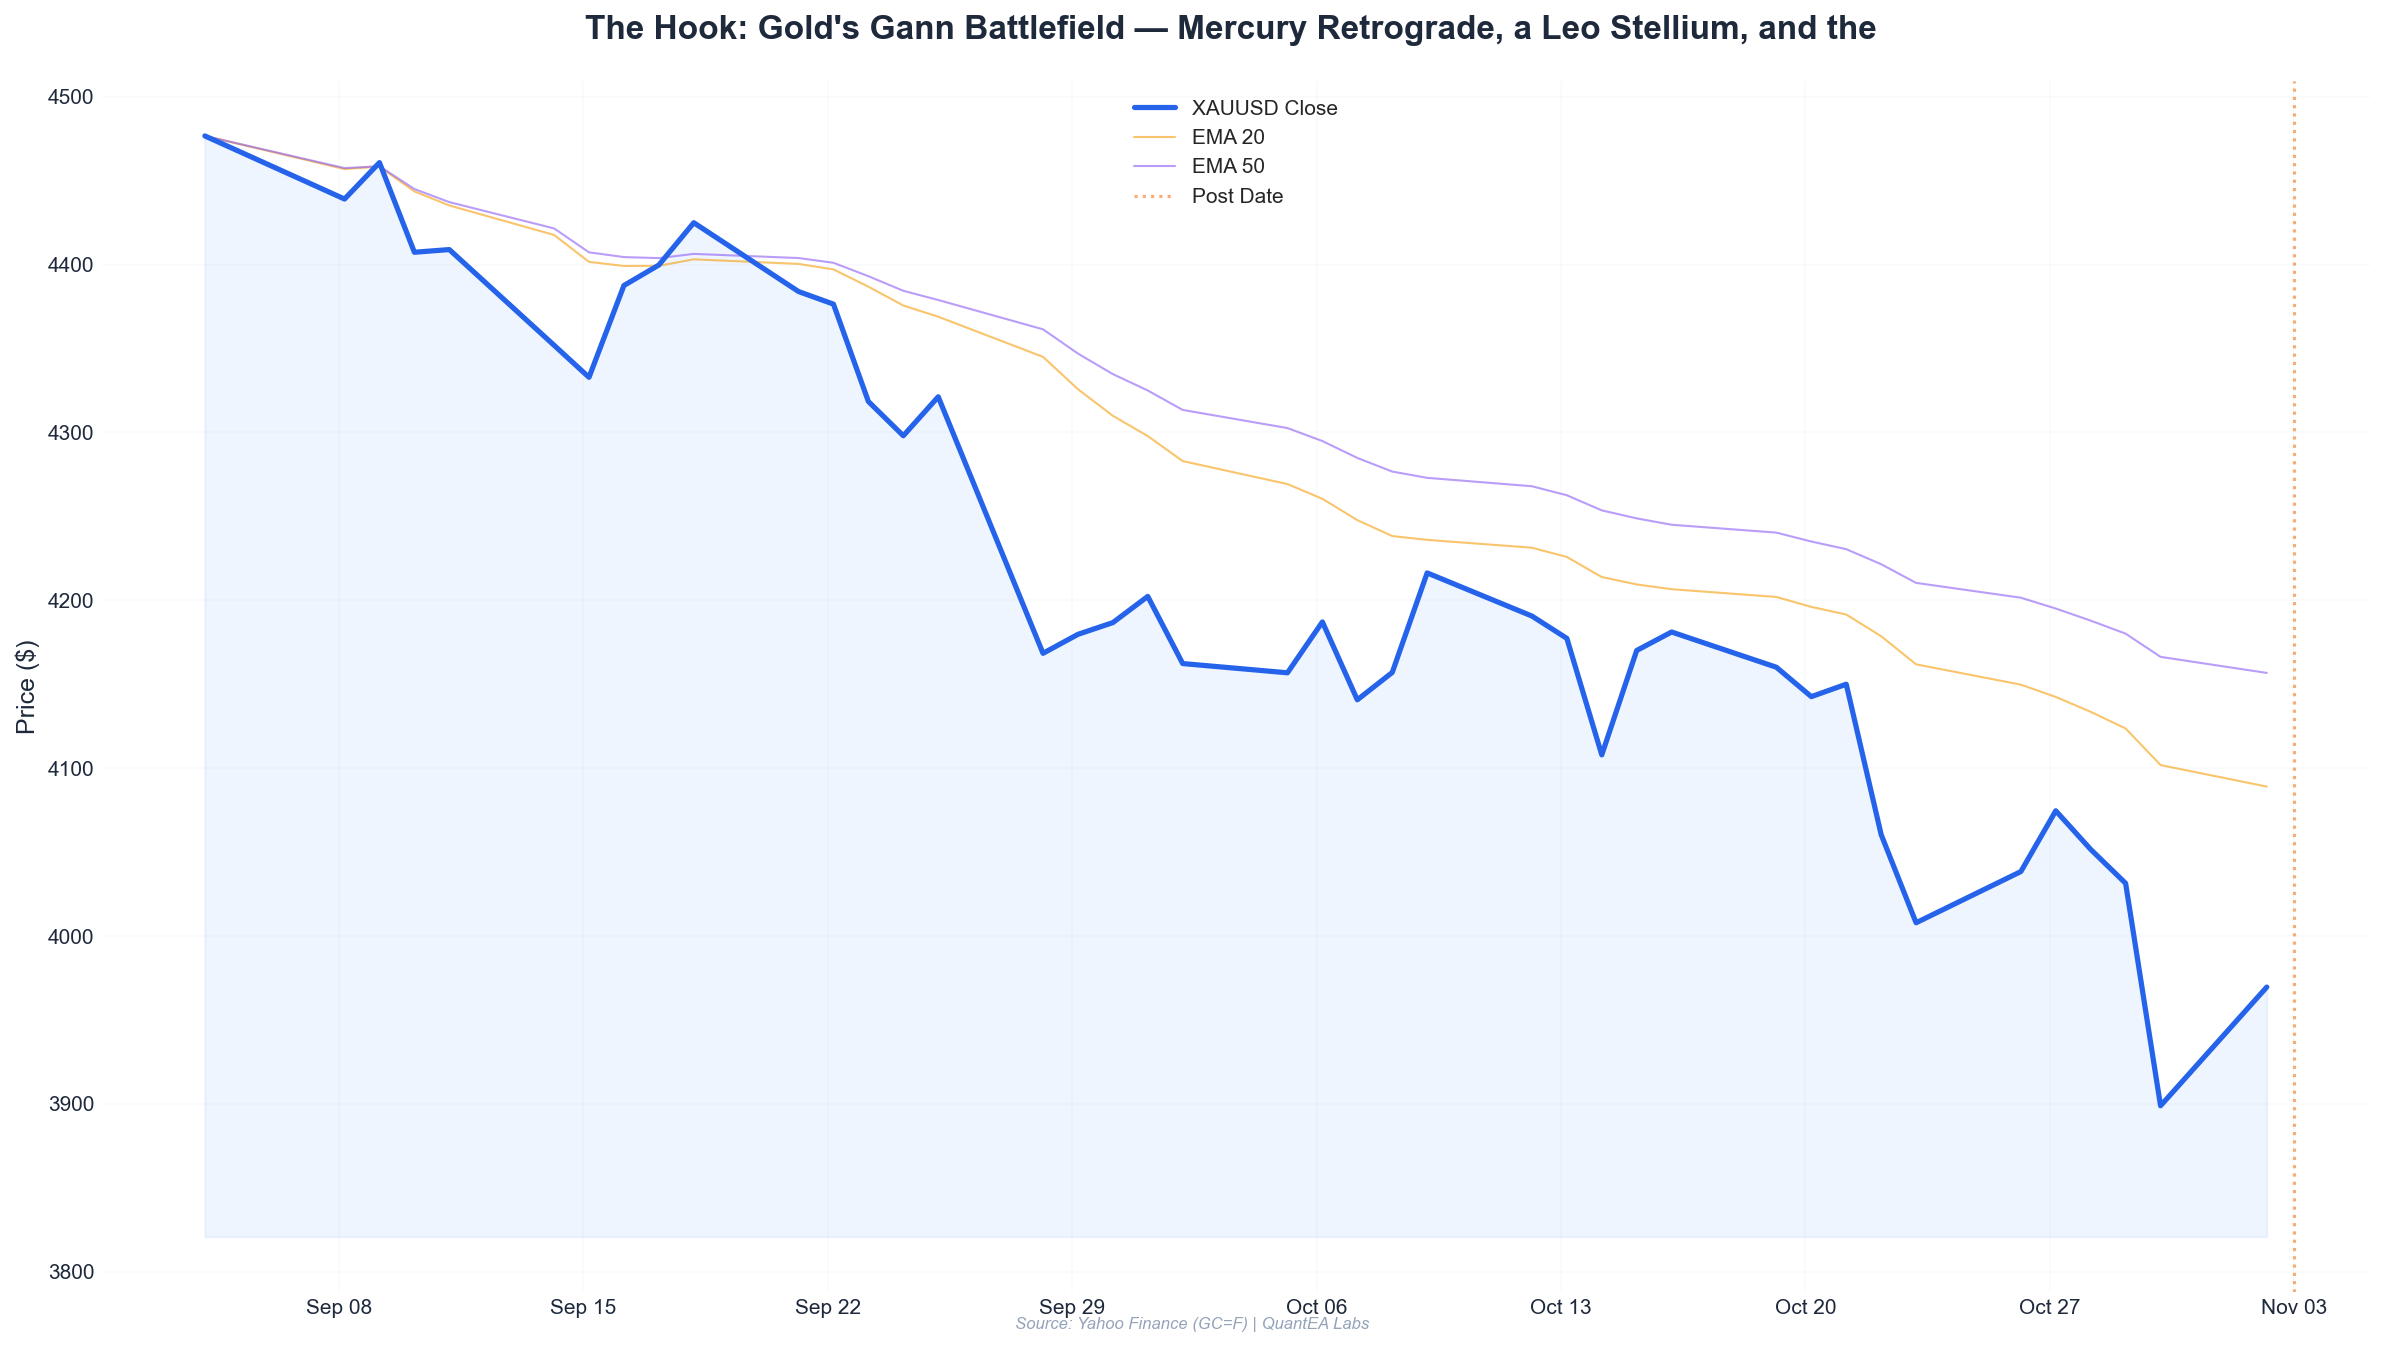
The Hook: Gold's Gann Battlefield — Mercury Retrograde, a Leo Stellium, and the 3,890 Line
Gold outlook for the week of Nov 3, 2026: Mercury and Venus retrograde, a Sun-Mercury-Venus Libra cluster, Jupiter in Leo, and Gann Square of 9 levels that decide the tape.
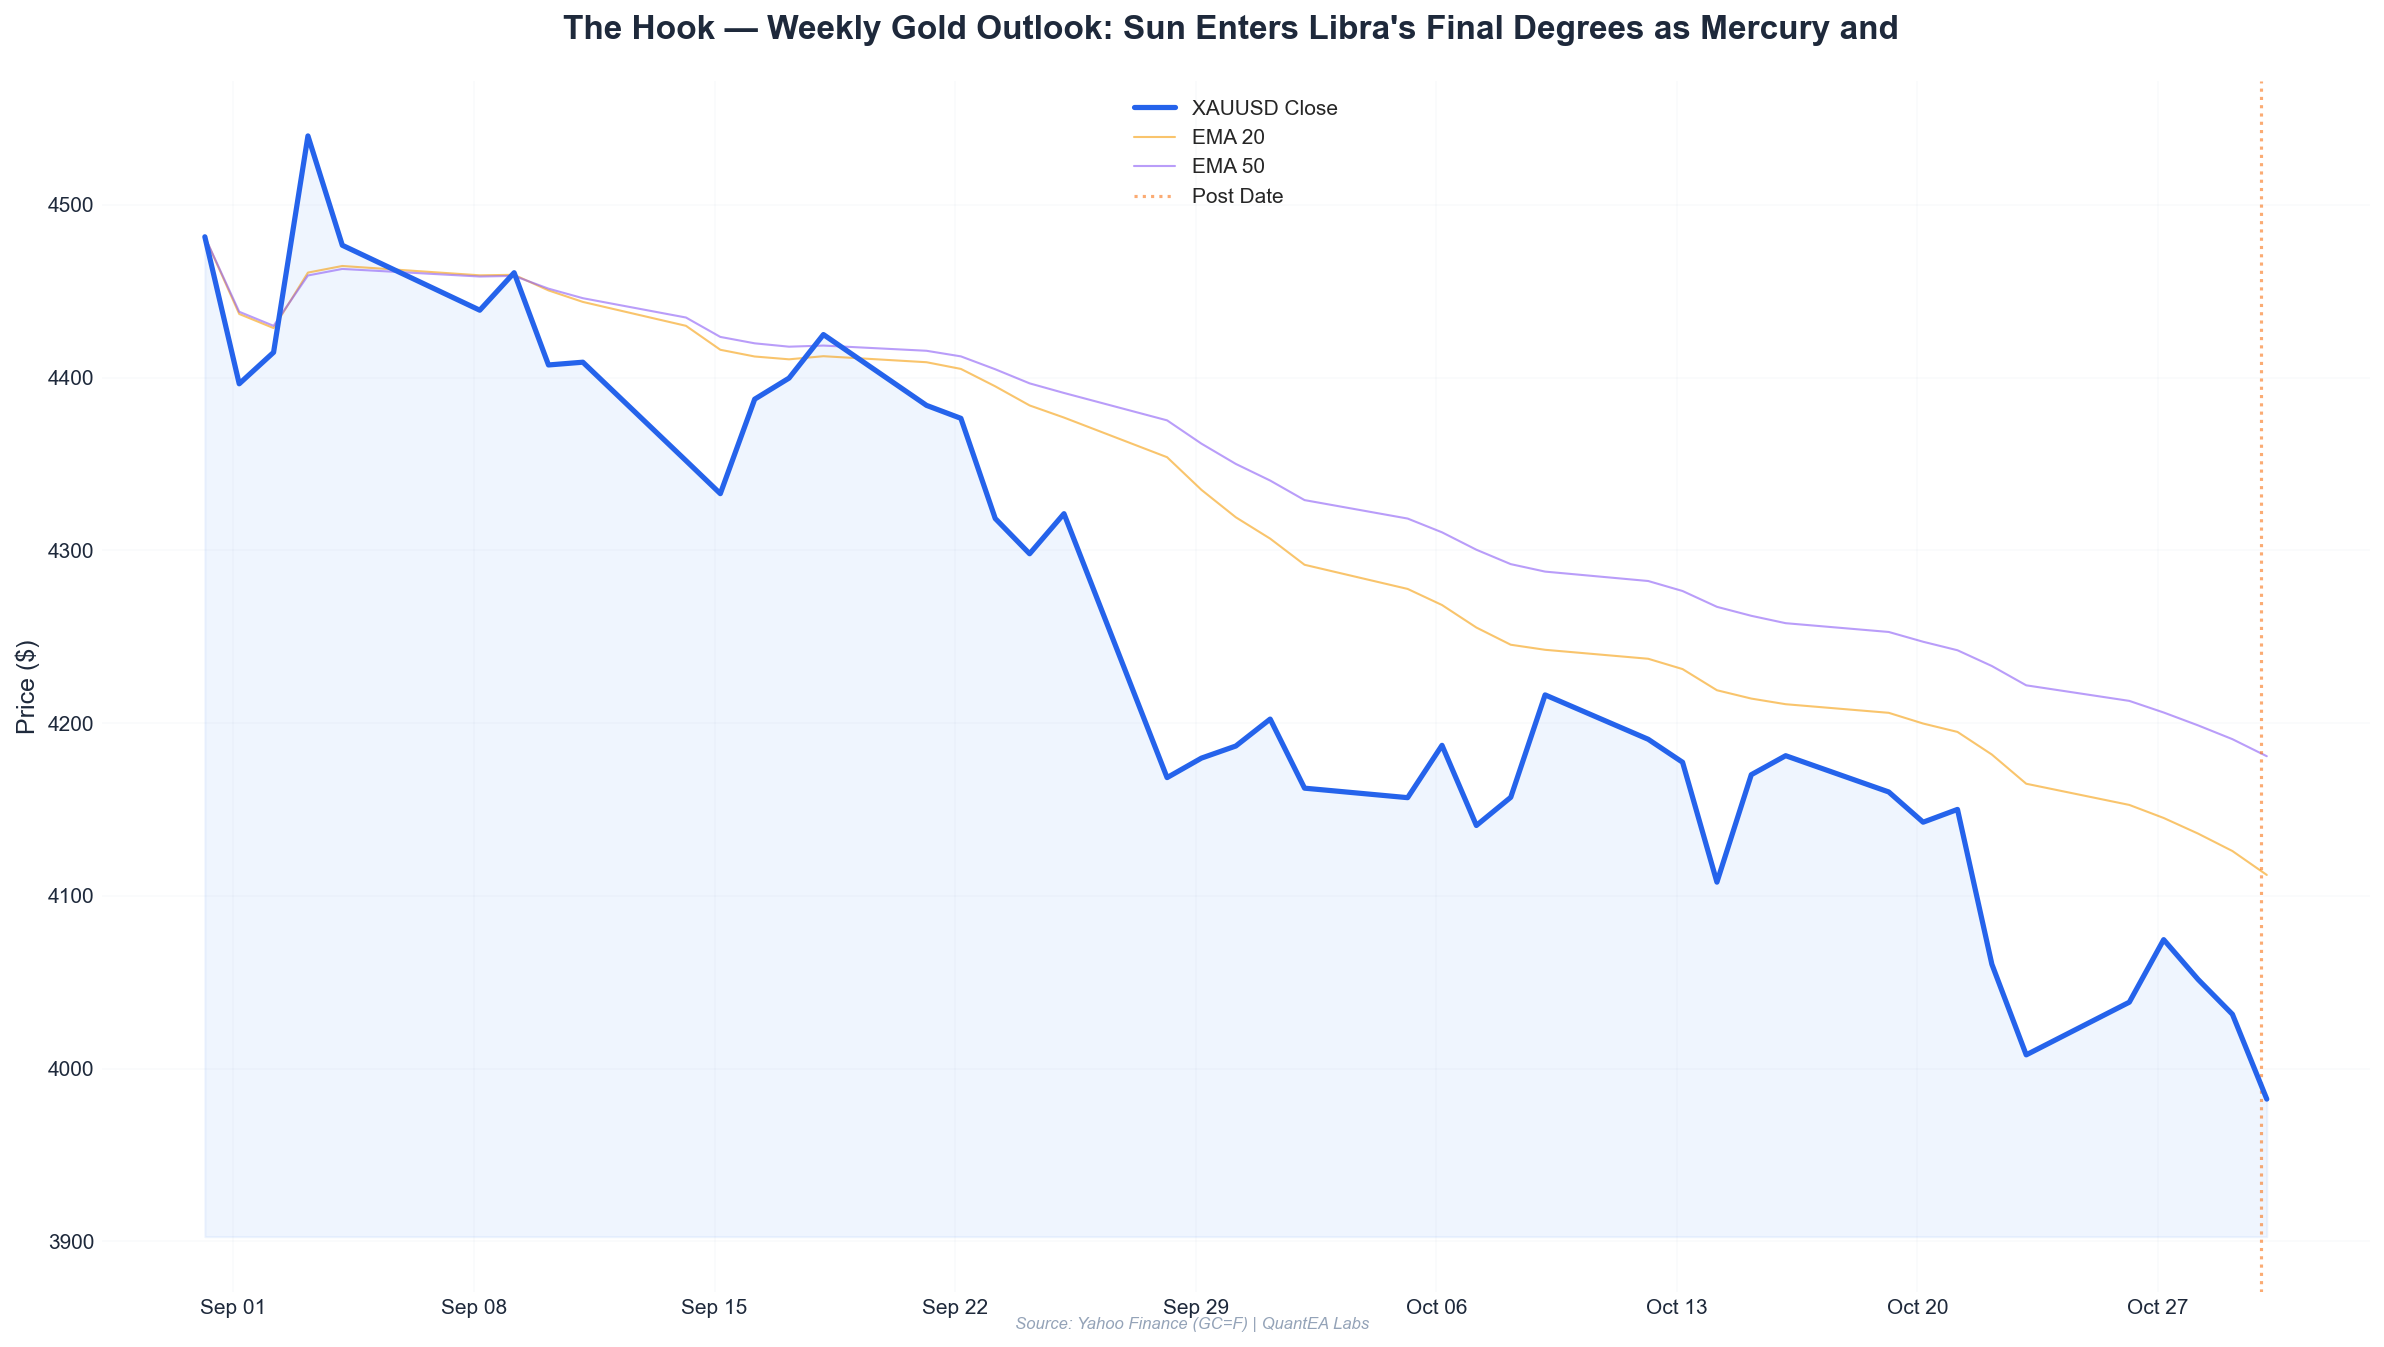
The Hook — Weekly Gold Outlook: Sun Enters Libra's Final Degrees as Mercury and Venus Both Retrograde
Gold closes October at $3,982 after a 1.27% drop. With Mercury and Venus retrograde in Libra and the Sun at 12° Swati, we map Gann Square of 9 levels for the week ahead.
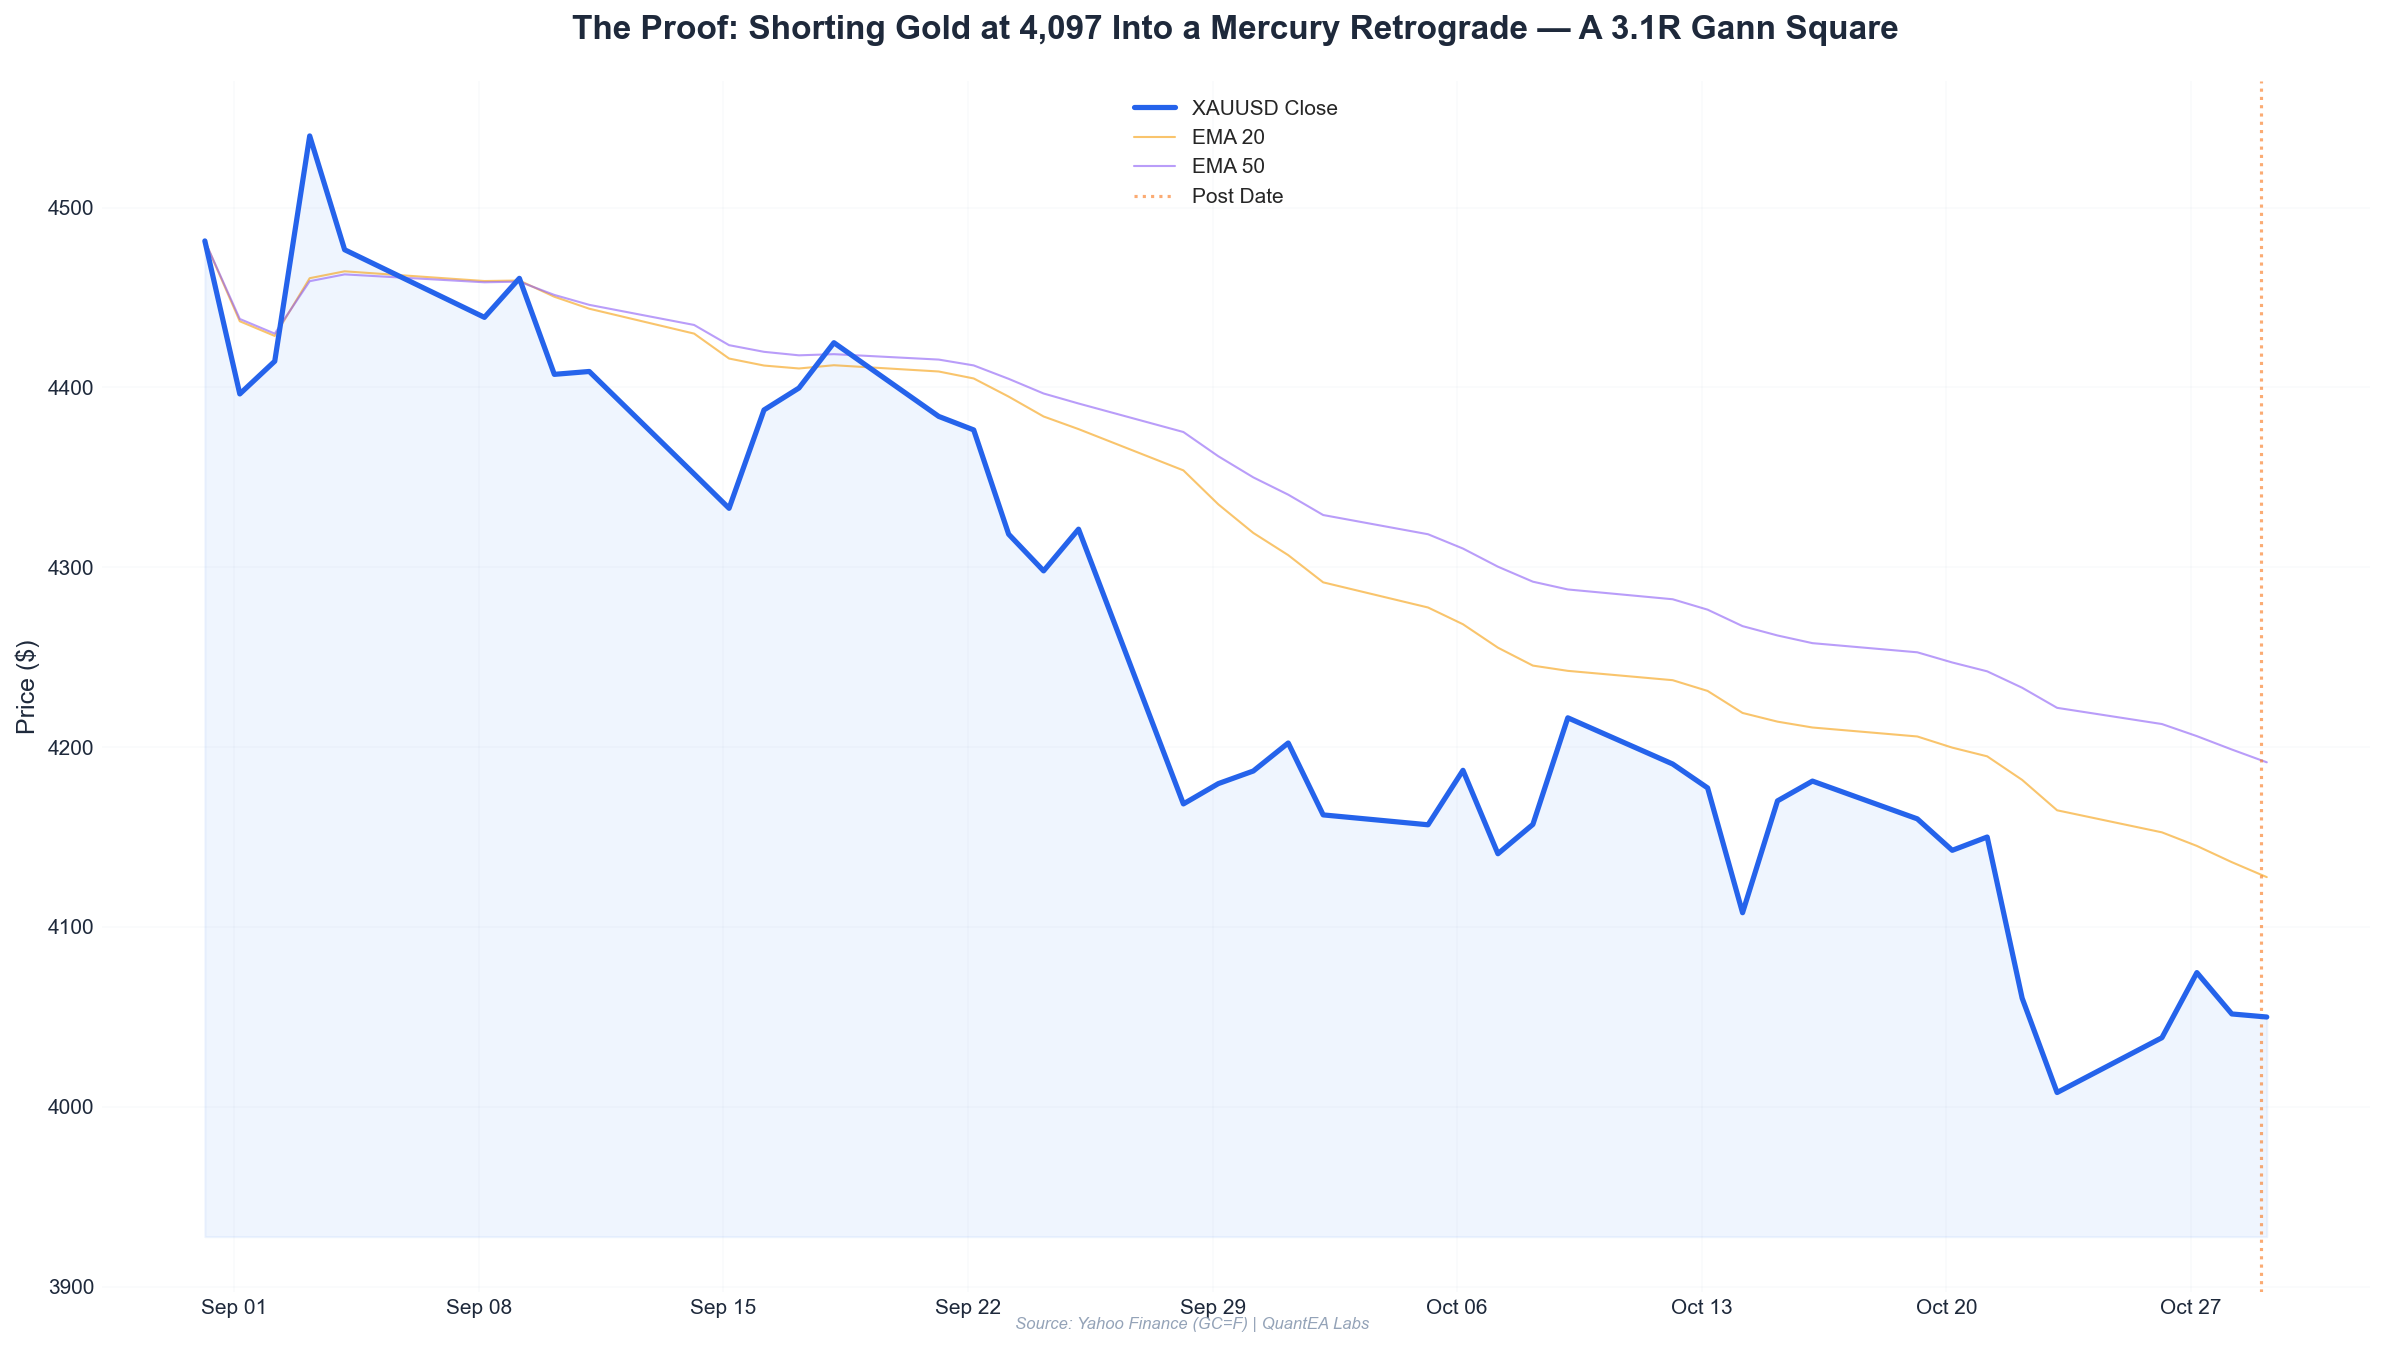
The Proof: Shorting Gold at 4,097 Into a Mercury Retrograde — A 3.1R Gann Square of 9 Breakdown
A full trade autopsy of a gold short from October 28, 2026 — Gann Square of 9 targets, sidereal transit timing, and the position-sizing math behind a 3.1R result.
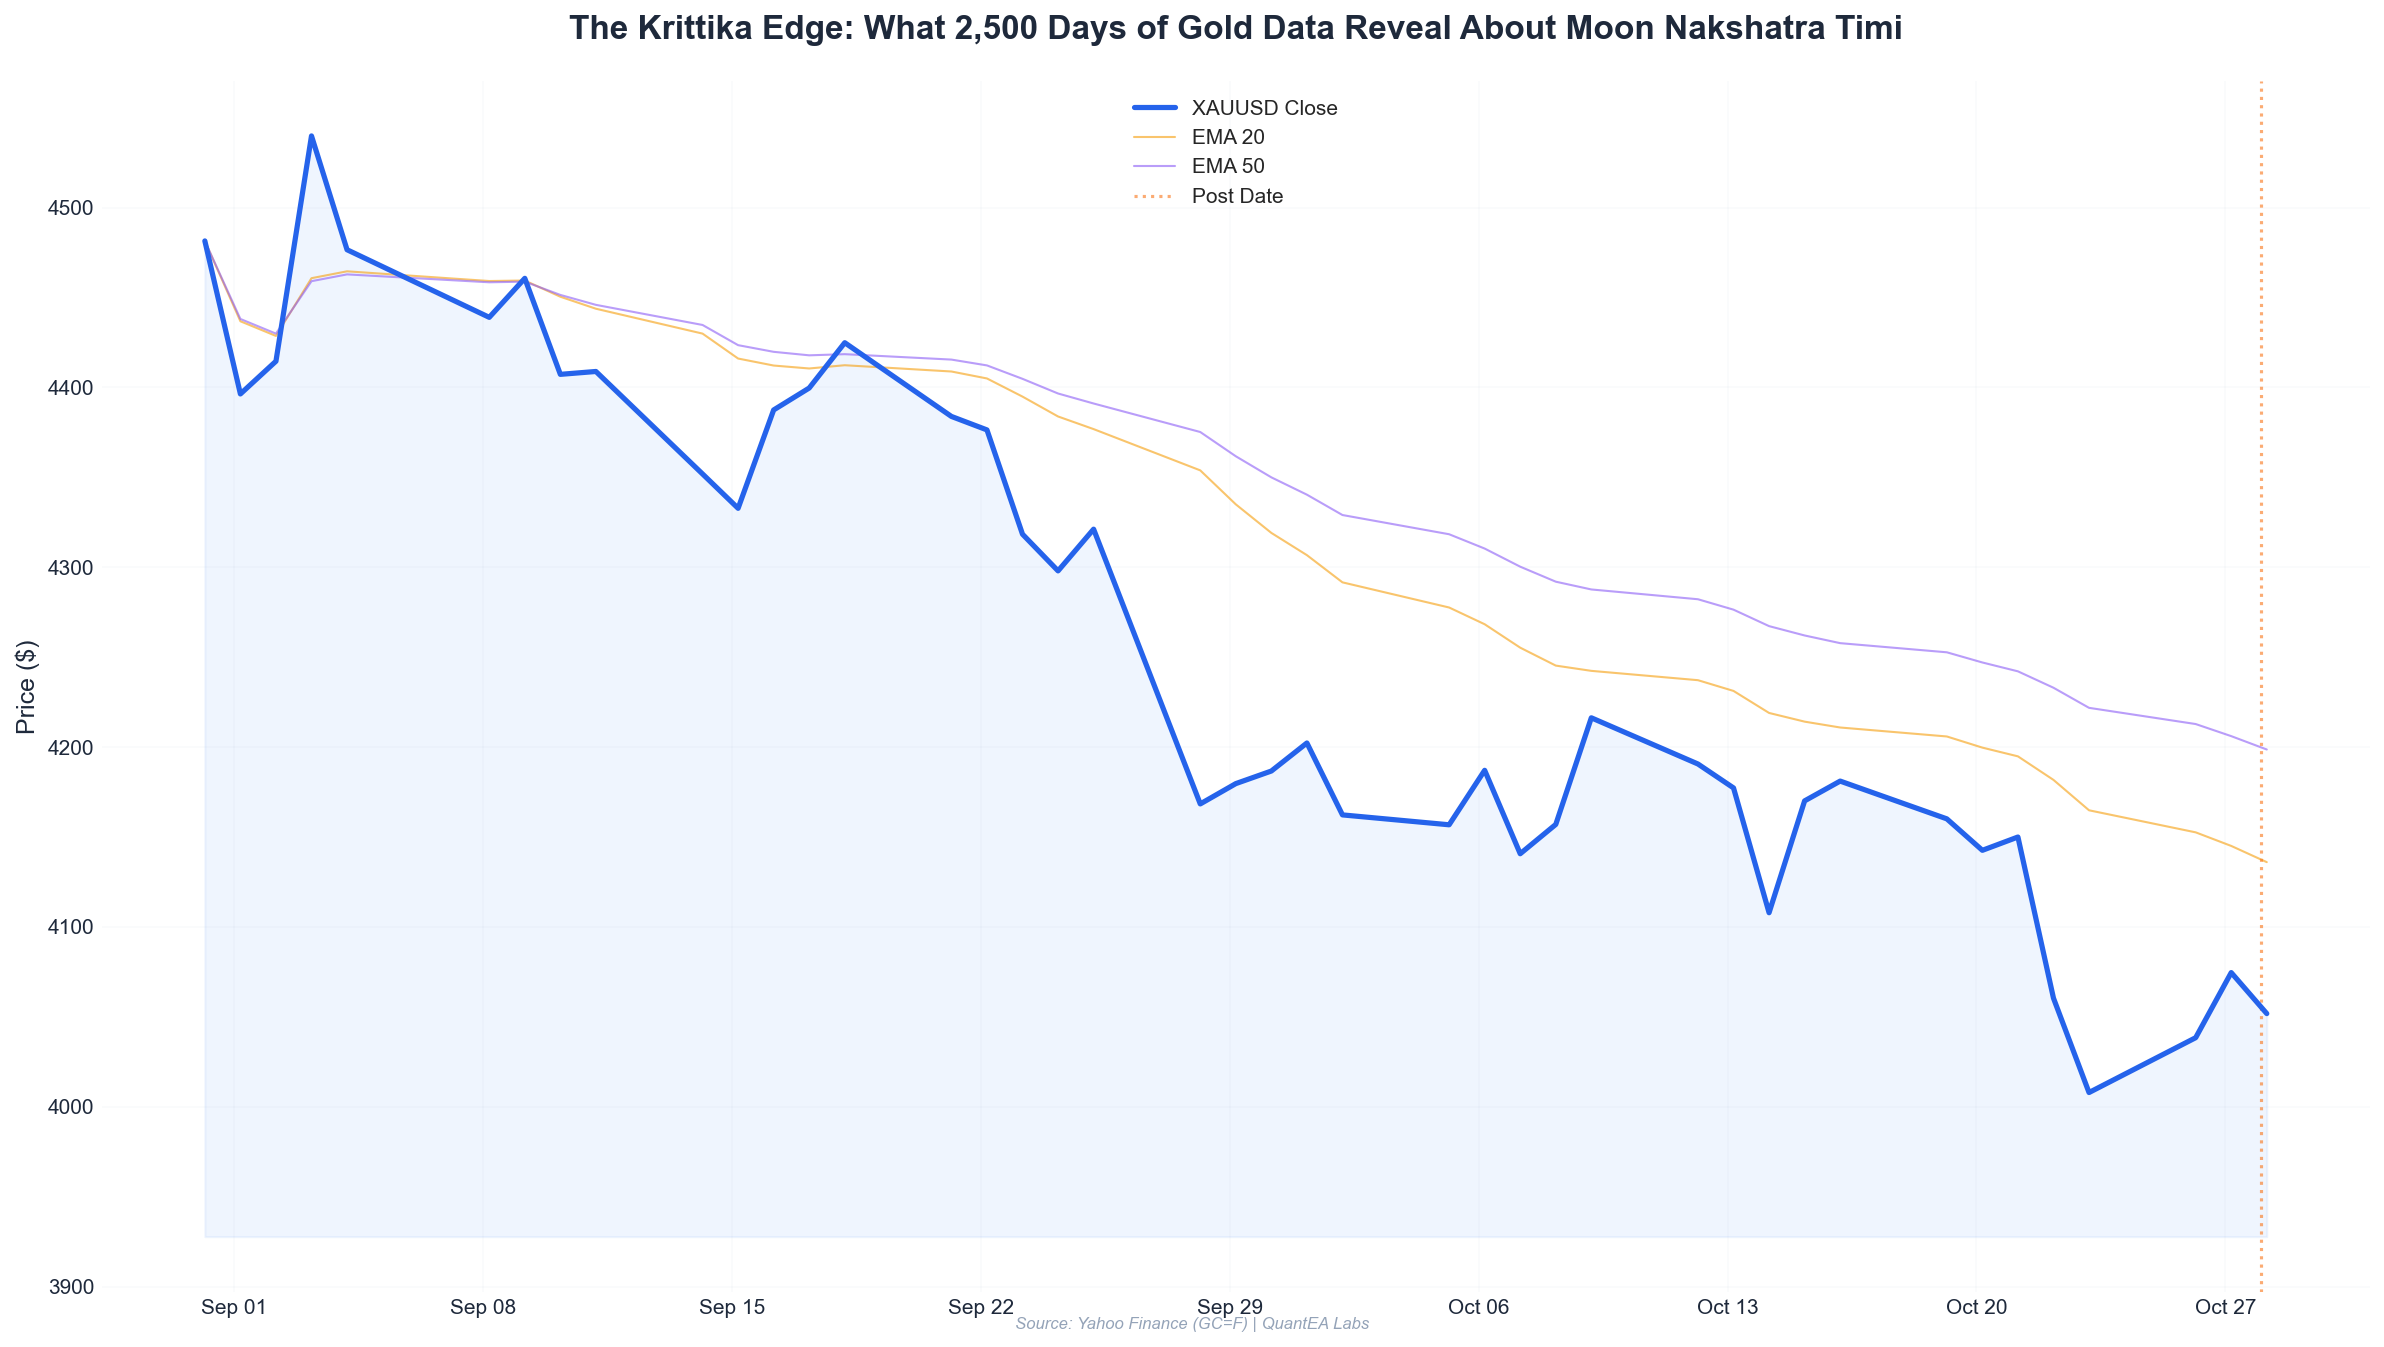
The Krittika Edge: What 2,500 Days of Gold Data Reveal About Moon Nakshatra Timing
A 10-year study of 2,500+ trading days shows gold's behavior under Krittika differs sharply from other nakshatras — with a 61.3% directional edge and a 2.14 profit factor. Here is the data.