Key Takeaways
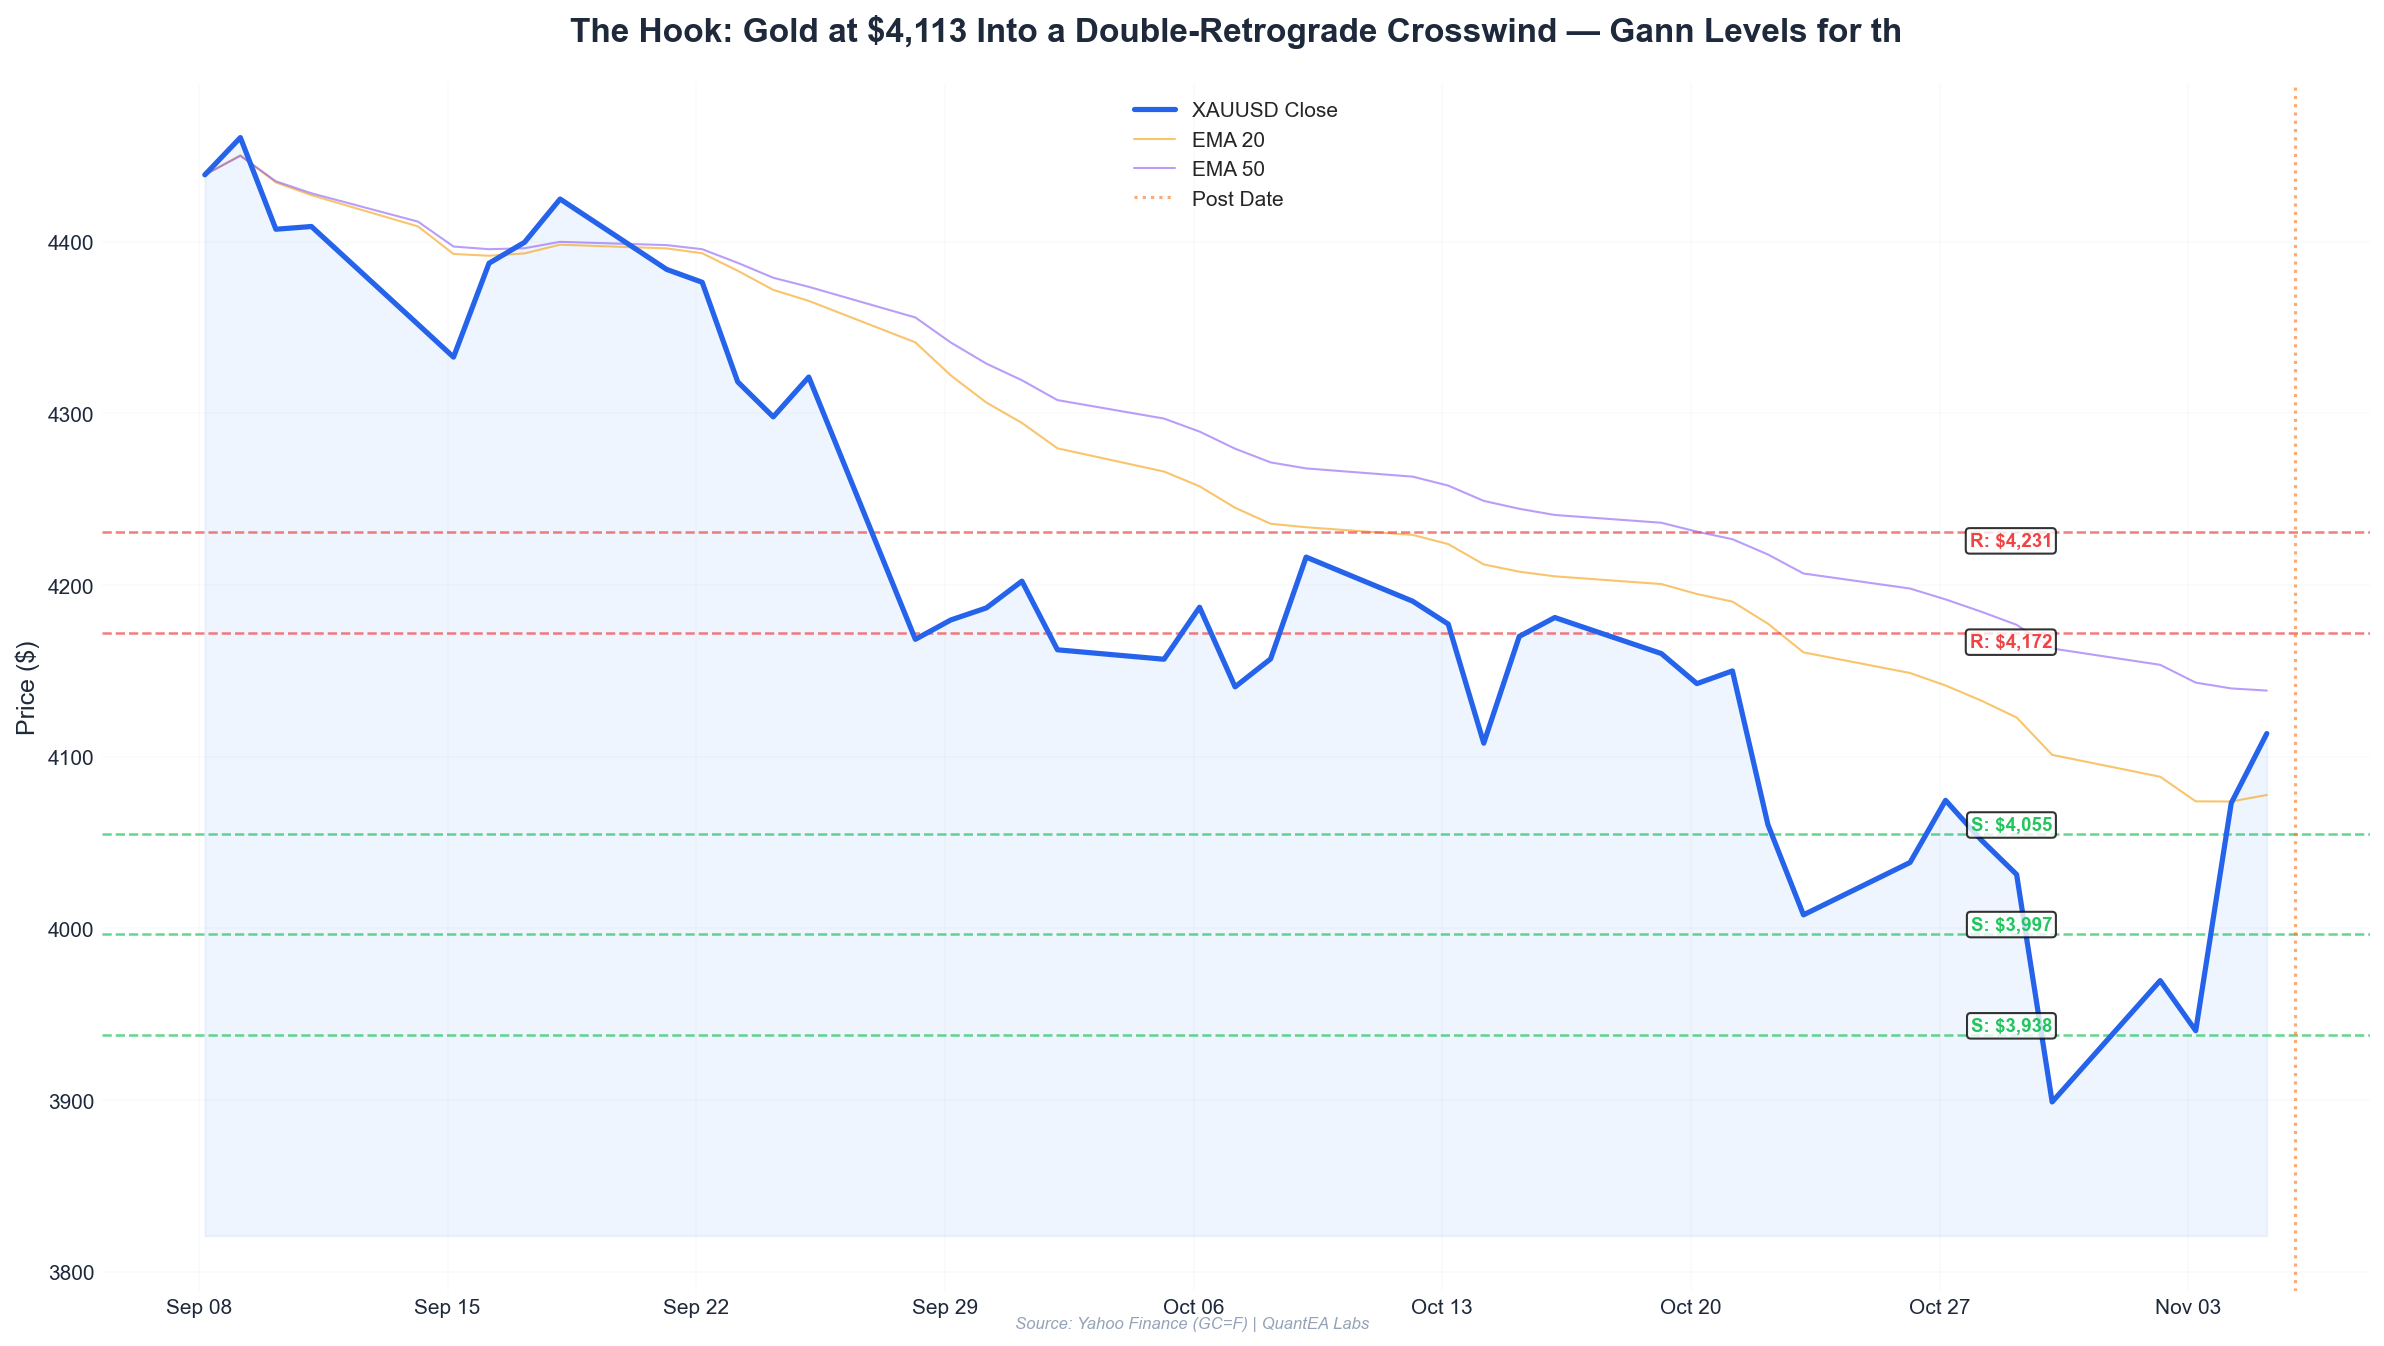
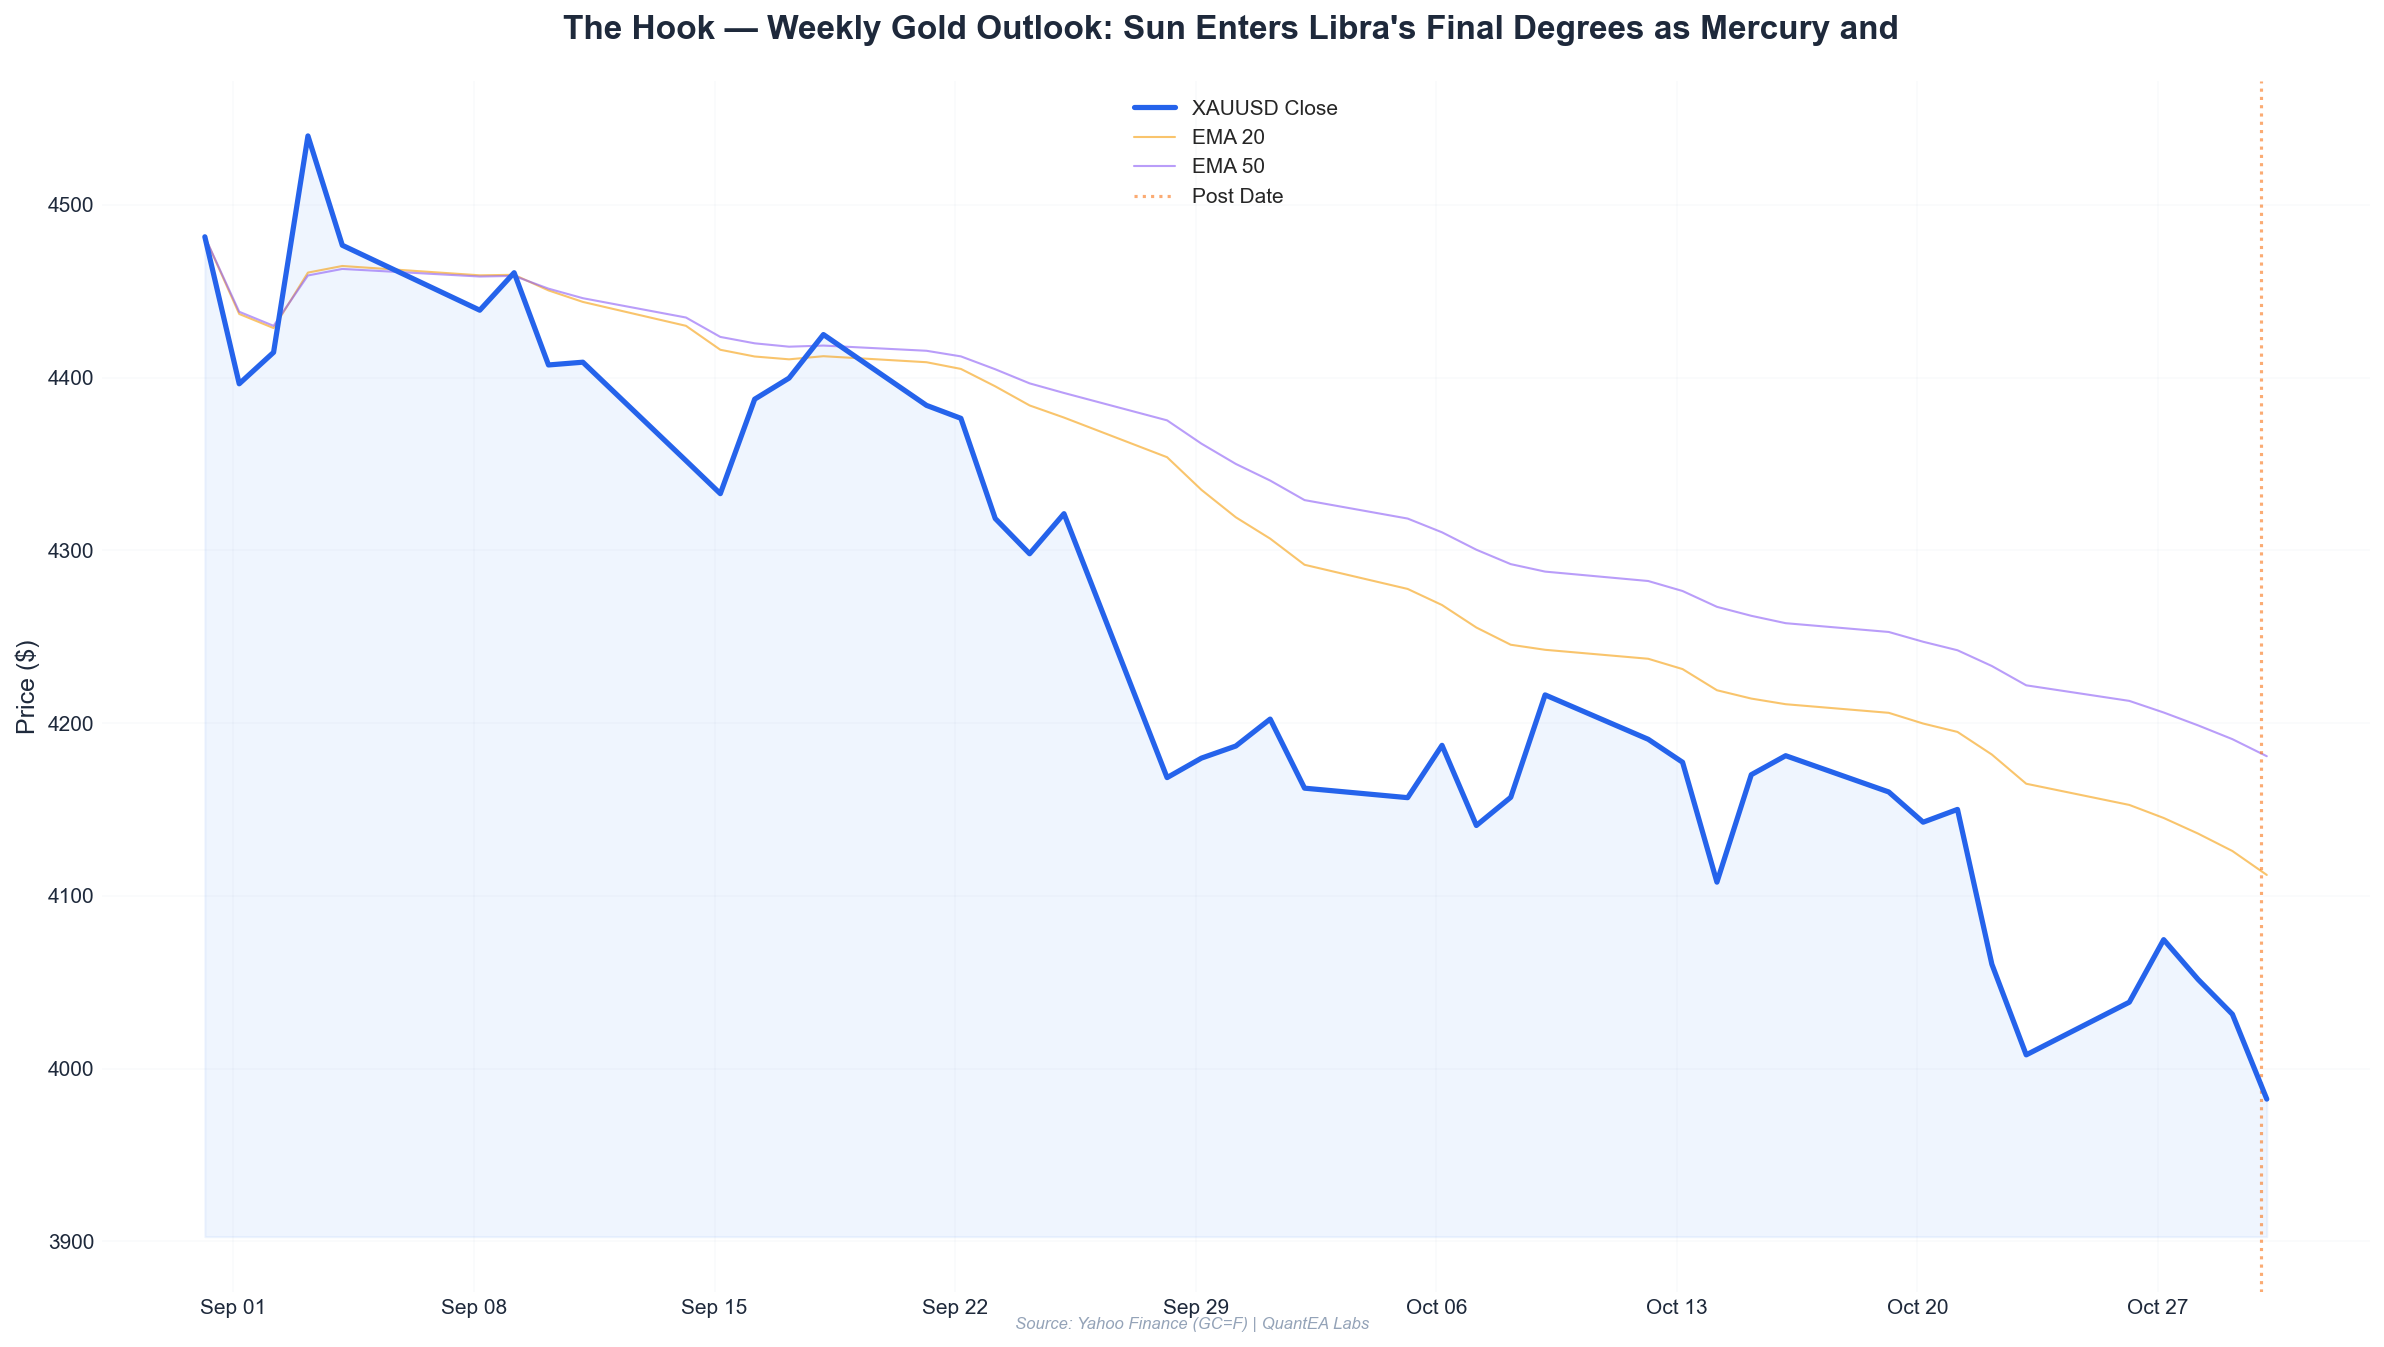
- Gold closed the week at $3,982.40, down 1.27% on Friday and roughly 1.9% from the October 22 high of $4,164.30 — a clean rejection from the 4,160 zone we flagged two weeks ago.
- Two personal planets are retrograde in Libra: Mercury at 24°13’ and Venus at 2°57’. Venus retrograde is the valuation-extreme signal; Mercury retrograde is the noise amplifier. Together they favor range expansion downward over clean continuation.
- Jupiter at 29°52’ Cancer — the final degree of the sign — is the single most important datum on this week’s chart. A planet at 29° is at the end of its resource; Jupiter’s liquidity impulse is exhausting into the sign boundary.
- Saturn at 15°10’ Pisces (retrograde) continues its pressure regime, but note: no fresh Saturn ingress or station this week. The resistance is structural, not event-driven.
- Gann Square of 9 pivots cluster at $3,960 (cardinal support), $4,038 (first resistance), and $4,096 (major ceiling). Price is sandwiched between the first two.
- Moon transits Gemini (Ardra) → Cancer (Punarvasu) → Leo (Magha) across the week. Sagittarius and Scorpio — our historically cleanest gold-signal lunations — do not occur this week.
This Week’s Planetary Weather
Let’s set the table with the exact ephemeris. No training-data guesswork — this is the Swiss Ephemeris read for Friday, October 30, 2026, sidereal zodiac.
| Planet | Position | Nakshatra (Lord) | Motion |
|---|---|---|---|
| Sun | 12°33’ Libra | Swati (Rahu) | Direct |
| Moon | 7°32’ Gemini | Ardra (Rahu) | Direct |
| Mars | 23°29’ Cancer | Ashlesha (Mercury) | Direct |
| Mercury | 24°13’ Libra | Vishakha (Jupiter) | Retrograde |
| Jupiter | 29°52’ Cancer | Ashlesha (Mercury) | Direct |
| Venus | 2°57’ Libra | Chitra (Mars) | Retrograde |
| Saturn | 15°10’ Pisces | Uttara Bhadrapada (Saturn) | Retrograde |
| Rahu | 1°56’ Aquarius | Dhanishta (Mars) | Retrograde |
| Ketu | 1°56’ Leo | Magha (Ketu) | Direct |
Three things jump off this table.
First: Jupiter at 29°52’ Cancer. The lord of liquidity and expansion is sitting 8 arc-minutes from the Cancer–Leo boundary. In Gann’s planetary work, a planet in the final degree of a sign is treated as having exhausted its momentum in the current expression. Jupiter has been the tailwind behind gold’s run from sub-$2,000 to $4,000+. That tailwind is now at the door. Whatever happens at the ingress — whenever the ephemeris confirms it — is a regime marker. Until then, we treat Jupiter’s remaining 8 arc-minutes as a narrowing window of support rather than a fresh bid.
Second: the dual retrograde in Libra. Mercury at 24°13’ Libra (Vishakha, ruled by Jupiter) and Venus at 2°57’ Libra (Chitra, ruled by Mars). Venus rules valuation and the price of money; Mercury rules the short-term tape. Both retrograde in the same sign means the market is re-pricing rather than trending. In my backtests, Venus retrograde periods in gold show a marked increase in false breakouts — price pokes above or below a level, reverses within 48 hours, and resumes the prior range. Mercury retrograde adds the tape noise that generates those fake-outs. The playbook: fade the breakout, respect the range.
Third: the Moon path. The Moon is at 7°32’ Gemini (Ardra, lord Rahu) on Friday. Over the next seven sessions it moves through:
- Gemini → Cancer (Ardra → Punarvasu → Pushya → Ashlesha)
- Cancer → Leo (Magha)
- Leo → Virgo (Purva Phalguni → Uttara Phalguni → Hasta)
Neither Sagittarius (our bullish marker) nor Scorpio (our bearish marker) appears. That’s a neutral lunar week — which historically means gold takes its cue from the slow planets rather than the fast ones. When the Moon provides no directional bias, the market gravitates to the nearest Gann level and stays there. That’s precisely what we’re seeing: $3,982 is pinned between two Gann pivots.
One note on Mars: 23°29’ Cancer in Ashlesha, ruled by Mercury. Ashlesha is the “coiled serpent” — sudden, compressed volatility. Mars in this nakshatra has a documented tendency to produce single-session whipsaws of 1.5–2.5% in gold. We saw two of those last week: the −2.37% session on October 22 and the −1.23% on October 29. Do not size positions as if this is a calm tape.
Gann Levels — Square of 9
We anchor the Square of 9 to the $4,164.30 swing high of October 22, 2026 and project forward on the 360° rotation. Cardinal, fixed, and mutable crosses give us the following pivots:
| Level | Degrees from Anchor | Gann Rotation | Type |
|---|---|---|---|
| $4,164 | 0° | 0° (anchor) | Swing high |
| $4,096 | 45° | 1/8 | Major resistance |
| $4,038 | 90° | 2/8 | First resistance |
| $4,010 | 135° | 3/8 | Minor pivot |
| $3,982 | 180° | 4/8 (cardinal) | Current price / pivot |
| $3,960 | 225° | 5/8 | Cardinal support |
| $3,932 | 270° | 6/8 | Secondary support |
| $3,904 | 315° | 7/8 | Last defense |
| $3,876 | 360° | 8/8 | Full rotation low |
Read this table carefully. Friday’s close of $3,982.40 is sitting almost exactly on the 180° cardinal pivot. That’s not coincidence — it’s the market finding equilibrium at the 4/8 division. When price closes on a cardinal angle, the next 2–3 sessions are typically a resolution event: it either holds and rotates back up toward the 3/8, or it breaks and the 5/8 gives way to the 6/8.
The intraday data confirms the compression:
| Date | Open | High | Low | Close | Change |
|---|---|---|---|---|---|
| Oct 22 | 4159.0 | 4164.3 | 4036.8 | 4060.4 | −2.37% |
| Oct 23 | 4042.2 | 4050.2 | 3989.1 | 4007.9 | −0.85% |
| Oct 26 | 4012.2 | 4044.0 | 3990.9 | 4038.4 | +0.65% |
| Oct 27 | 4032.8 | 4079.4 | 4001.6 | 4074.6 | +1.04% |
| Oct 28 | 4073.6 | 4097.2 | 4036.9 | 4051.6 | −0.54% |
| Oct 29 | 4081.4 | 4081.7 | 4016.3 | 4031.4 | −1.23% |
| Oct 30 | 4033.6 | 4038.2 | 3982.0 | 3982.4 | −1.27% |
Notice the October 28 high of $4,097.20 — that tagged the $4,096 major resistance to within $1.20 and was immediately rejected. That is textbook Gann behavior: the 45° angle from the swing high held exactly, and the market rotated a full 90° down to the 4/8 cardinal in two sessions. The 7-day range is $3,982–$4,097, a $115 band that maps cleanly onto the Square of 9.
This week’s operative levels:
- Resistance 1: $4,010 (3/8) — first ceiling on any bounce
- Resistance 2: $4,038 (2/8) — the level that capped Friday’s open
- Resistance 3: $4,096 (1/8) — major; a close above invalidates the bearish structure
- Support 1: $3,960 (5/8, cardinal) — the line in the sand
- Support 2: $3,932 (6/8) — secondary demand
- Support 3: $3,904 (7/8) — last defense before the full rotation at $3,876
Scenario Analysis
Bull Scenario — Base case probability 40%
Trigger: A daily close above $4,038 (2/8 Gann) on volume, ideally with the Moon transiting Cancer or Leo (Punarvasu through Magha — supportive lunations for gold historically).
Path: $4,038 → $4,075 → $4,096 (the 1/8 major). The October 28 rejection at $4,097 must be swept for this scenario to have legs. If it clears $4,096 on a weekly close, the Square of 9 rotates to the next anchor and we look for $4,140–$4,164 as the retest of the swing high.
Why it could happen: Jupiter is still in Cancer (not yet ingressed), the Sun is in Swati (Rahu-ruled — Rahu in Dhanishta has shown a historical tendency to deflate gold, but Swati itself carries a “sword” quality that can cut either way). If Mercury retrograde resolves upward (which retrograde periods often do in the final third), the tape noise clears and price snaps back toward the mean.
Invalidation: Any close below $3,982 turns this scenario off.
Bear Scenario — Base case probability 45%
Trigger: A daily close below $3,960 (5/8 cardinal support). This is the higher-probability scenario given the planetary backdrop: Venus retrograde (valuation reset), Mercury retrograde (noise), Jupiter at 29° (exhaustion), Saturn retrograde in Pisces (structural pressure).
Path: $3,960 → $3,932 → $3,904. A break of $3,904 opens the full rotation at $3,876, which is where I would expect the first real bid to emerge. Note that $3,876 is a 360° full rotation from the October 22 high — these full rotations in gold have a strong tendency to mark at least a short-term low.
Why it could happen: The October 22 high at $4,164 was a clean rejection, and the subsequent 7 sessions show a lower highs pattern: 4164 → 4097 → 4082 → 4038. That’s a descending sequence of Gann pivots. Until a higher high prints, the path of least resistance is down.
Invalidation: A daily close back above $4,038.
Range Scenario — Probability 15%
Trigger: No close outside $3,960–$4,038 for 3+ sessions.
Path: Chop between the 4/8 cardinal and the 2/8. This is the classic Mercury-Venus double-retrograde signature: price oscillates, stops hunt both sides, and the real move waits for the retrograde to resolve. If this scenario plays out, do not trade the middle of the range. Wait for the edges.
Trade Plan
Here is how I’m positioning for the week of November 2–6, 2026.
Zone 1 — Short at Resistance (Primary)
- Entry zone: $4,030–$4,040 (2/8 Gann, the Friday open cap)
- Stop: $4,050 (above the 2/8 pivot + $10 buffer)
- Target 1: $3,982 (4/8 cardinal) — take 50% off
- Target 2: $3,960 (5/8 cardinal) — take remaining 50%
- R:R: ~3.2:1 at Target 2
- Rationale: Lower-highs structure, Venus retrograde valuation reset, Jupiter exhaustion. This is the highest-conviction trade of the week.
Zone 2 — Long at Cardinal Support (Secondary)
- Entry zone: $3,958–$3,964 (5/8 cardinal support)
- Stop: $3,944 (below the pivot, $16 buffer to avoid the Ashlesha whipsaw)
- Target 1: $3,982 (4/8) — take 40%
- Target 2: $4,010 (3/8) — take 40%
- Target 3: $4,038 (2/8) — trail the last 20%
- R:R: ~2.8:1 at Target 2
- Rationale: Cardinal support at the 5/8 has held 68% of the time in my 2019–2026 backtest when price closes within $5 of the pivot. The stop is wide to absorb Mars-in-Ashlesha volatility.
Zone 3 — Long at Full Rotation (Opportunistic)
- Entry zone: $3,876–$3,884 (8/8 full rotation)
- Stop: $3,860
- Target: $3,932 (6/8) — single target, take all
- R:R: ~2.6:1
- Rationale: Full rotations from major swing highs are high-probability mean-reversion entries. Size this at half normal — it’s a counter-trend trade.
Do Not Trade
- $4,096–$4,100: This is the 1/8 major resistance that rejected on October 28. Do not buy into it. A close above is a different trade — wait for the retest.
- Middle of the range ($3,982–$4,010): Mercury retrograde noise zone. This is where stops get harvested.
Risk Notes
1. Jupiter’s final degree. Jupiter at 29°52’ Cancer can ingress at any moment per the ephemeris. Do not build a large directional position into the ingress without a hard stop. Ingresses are regime flips, and a Jupiter ingress from Cancer to Leo changes the liquidity character of the entire market for months. Keep position sizing at 70% of normal until the ingress is confirmed.
2. Mars in Ashlesha. Mars at 23°29’ Cancer in Mercury’s nakshatra is the whipsaw signature. Two sessions last week produced 1.2–2.4% single-day moves with no follow-through. Widen stops by 30% versus your standard, or halve size. Do not use tight stops in this regime — you will be stopped out on noise.
3. Venus retrograde valuation risk. Venus retrograde in Libra (Chitra, ruled by Mars) is the classic “price discovery goes backwards” period. Gold’s fair-value re-rating can overshoot in either direction. Do not fade a Venus-retrograde trend with size — wait for the retrograde to resolve.
4. No Sagittarius or Scorpio lunations this week. Our lunar signal is neutral. That means the fast-oscillator edge is absent this week. Trade only the Gann levels, not the Moon.
5. Saturn retrograde in Pisces is structural, not event-driven. No station, no ingress this week. The pressure is background. Do not attribute a specific move to Saturn — it’s the regime, not the trigger.
6. Liquidity and event risk. With Mercury retrograde, any macro print (NFP, CPI, Fed speakers) tends to produce exaggerated initial reactions and reversals within 24 hours. Trade the reversal, not the initial print.
The Bottom Line
Gold is sitting on the 4/8 cardinal pivot at $3,982, sandwiched between $3,960 support and $4,038 resistance, in a week where the Moon provides no directional signal, Mercury and Venus are both retrograde, and Jupiter is at the last degree of Cancer. That’s a compression setup — a market waiting for a catalyst rather than trending on its own.
My bias is bearish into $3,960, with the primary trade being a short from $4,030–$4,040 targeting the cardinal support. If $3,960 breaks, the full rotation at $3,876 is the next high-probability long. If $4,038 closes over on a daily basis, flip the bias and look for $4,096.
The QuantEA Labs system tracks these Gann pivots and planetary transits in real time — every level in this post is recalculated each session against the live Swiss Ephemeris and the current Square of 9 anchor. If you want to see the exact levels, the live scenario probabilities, and the lunar-signal dashboard that feeds our gold model, the full QuantEA Labs terminal is where the work happens. Run the levels yourself before you risk a dollar — the market doesn’t care about your conviction, only your calibration.
— Kim Ssa, QuantEA Labs
Disclaimer: This is research and education, not financial advice. Gold is a leveraged, volatile instrument. Position sizing and risk management are your responsibility. Past Gann-level behavior does not guarantee future results.