Key Takeaways
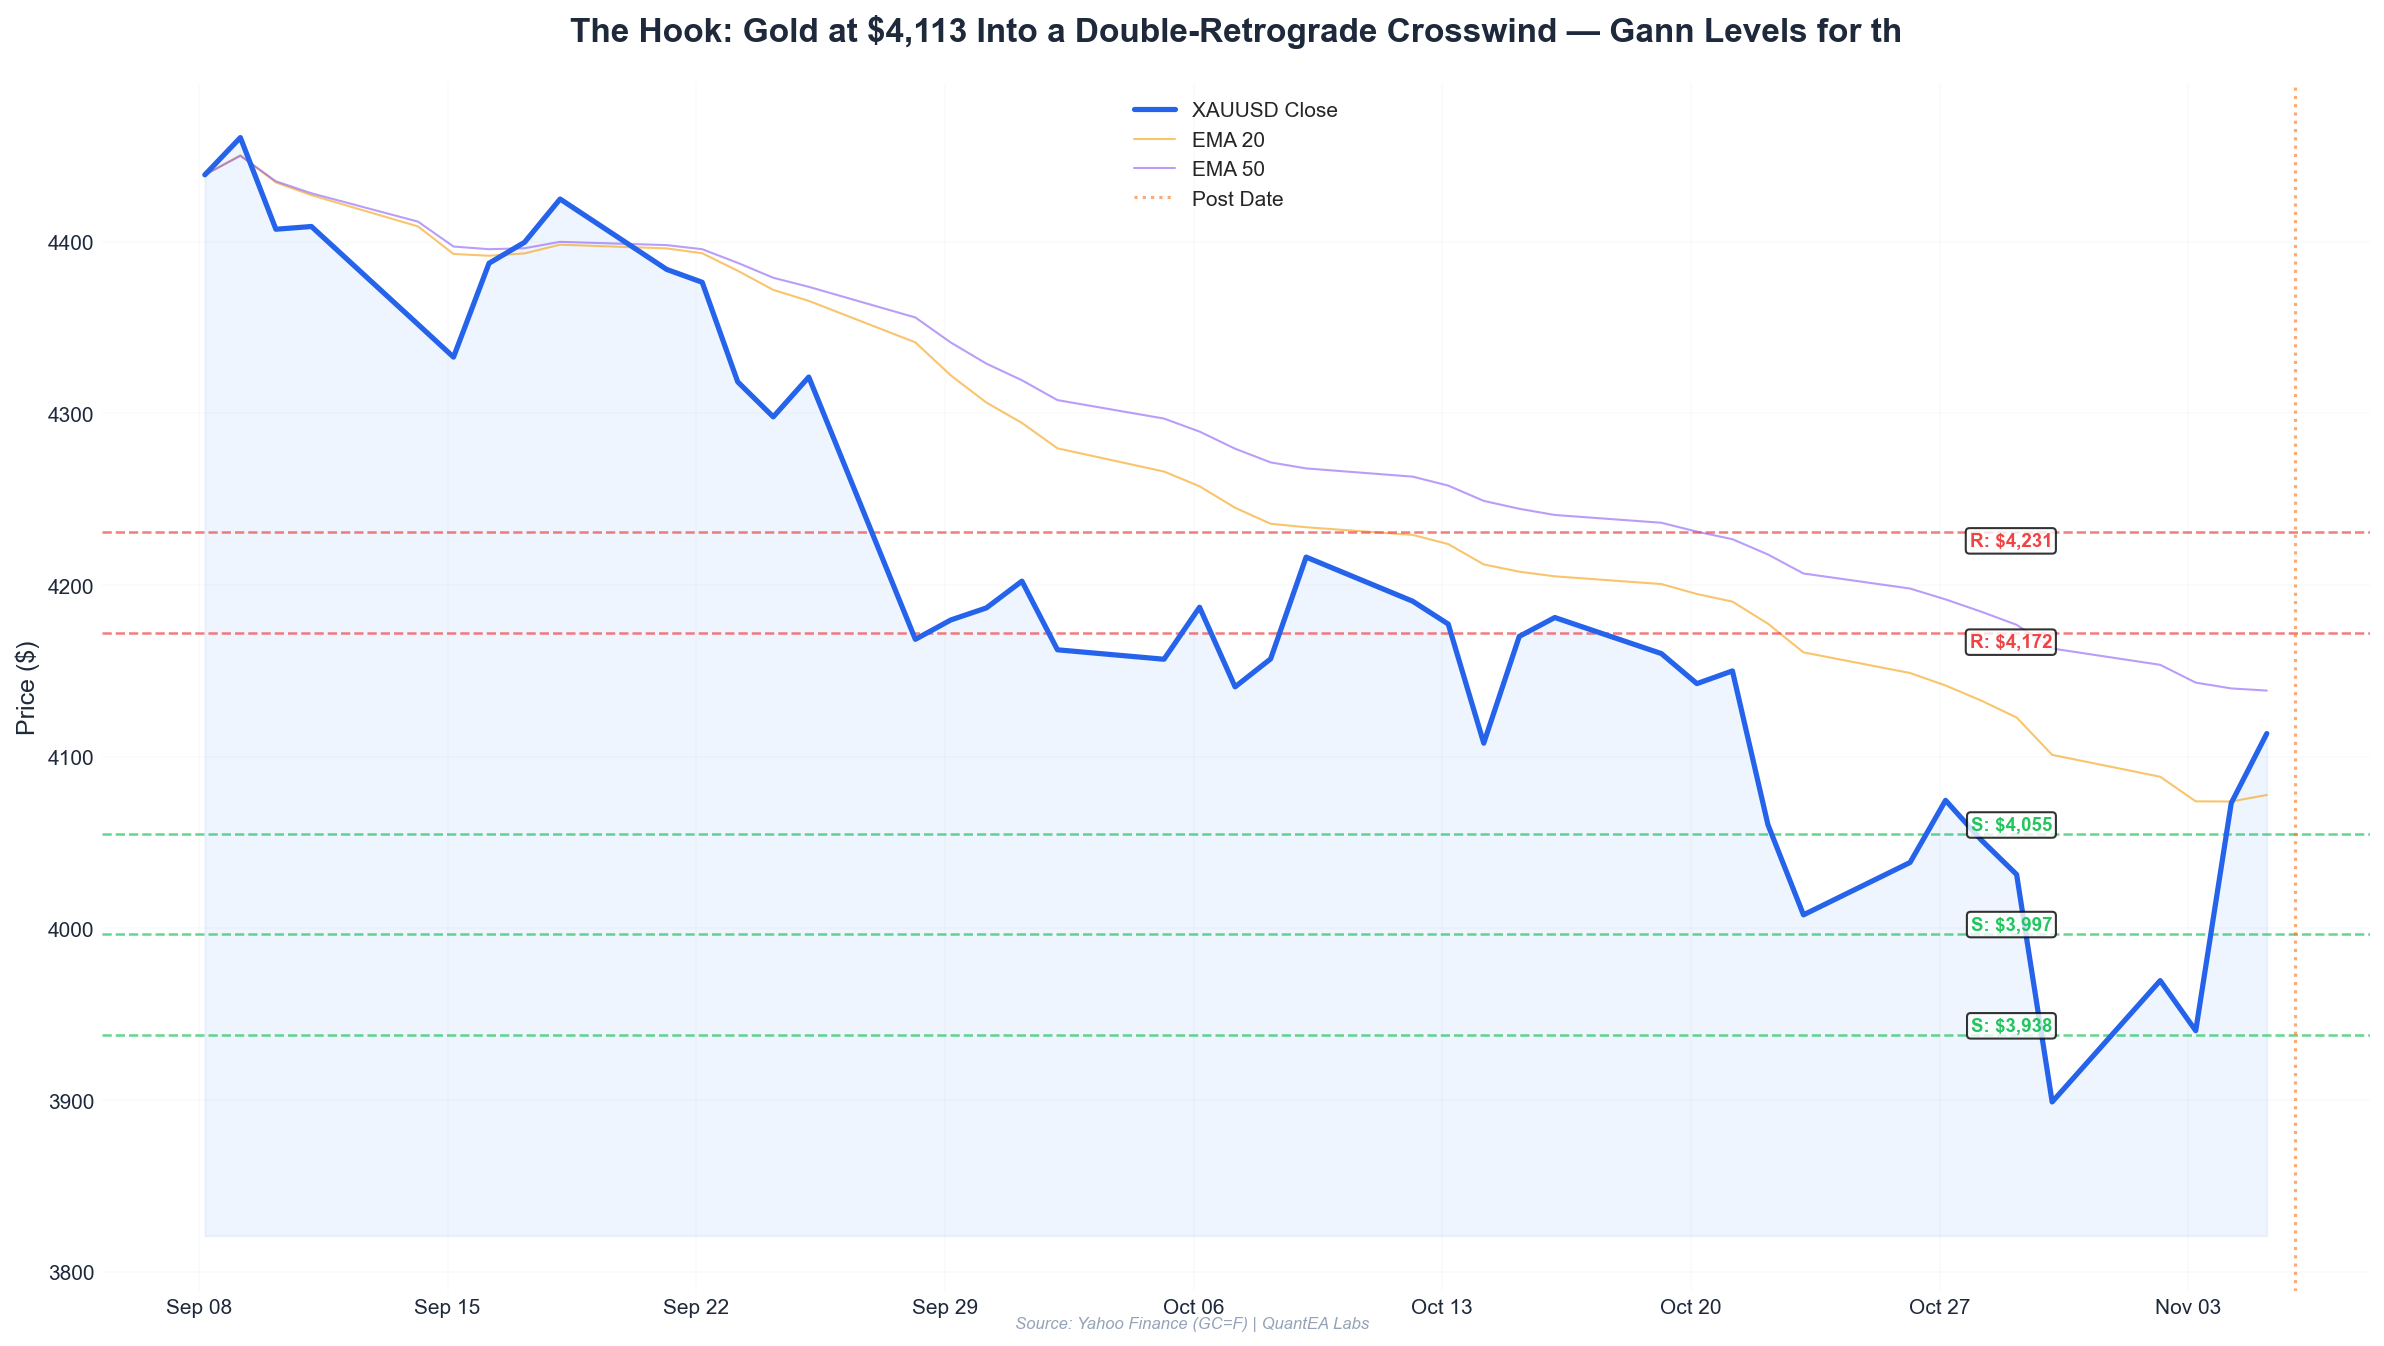
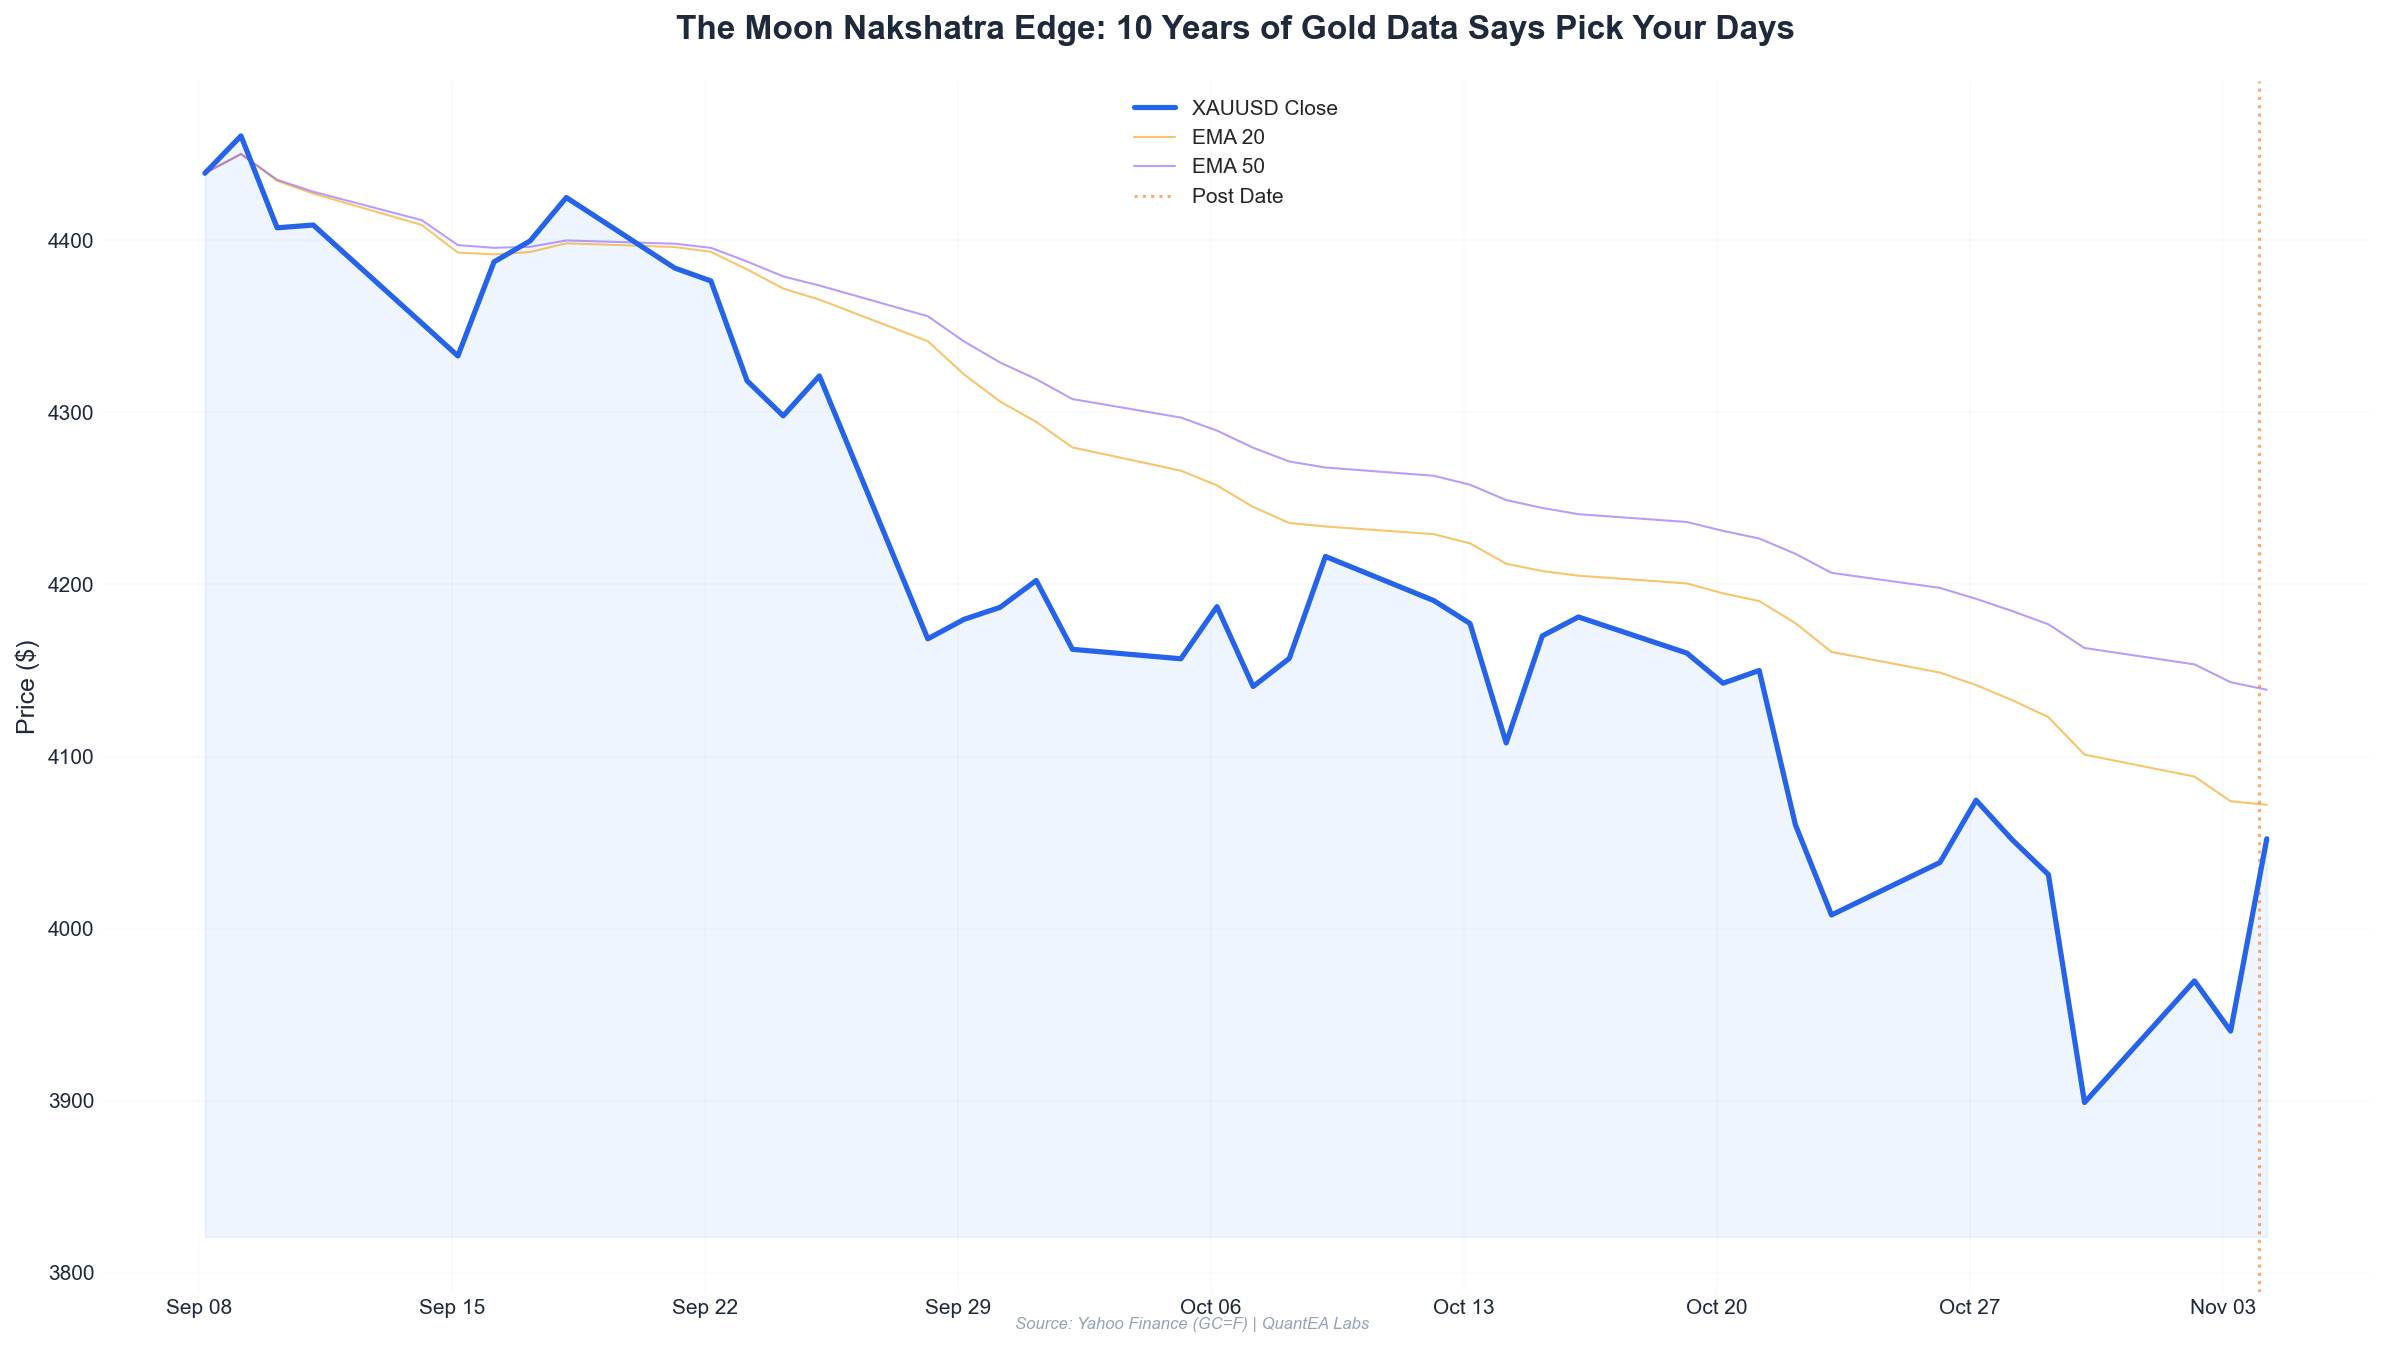
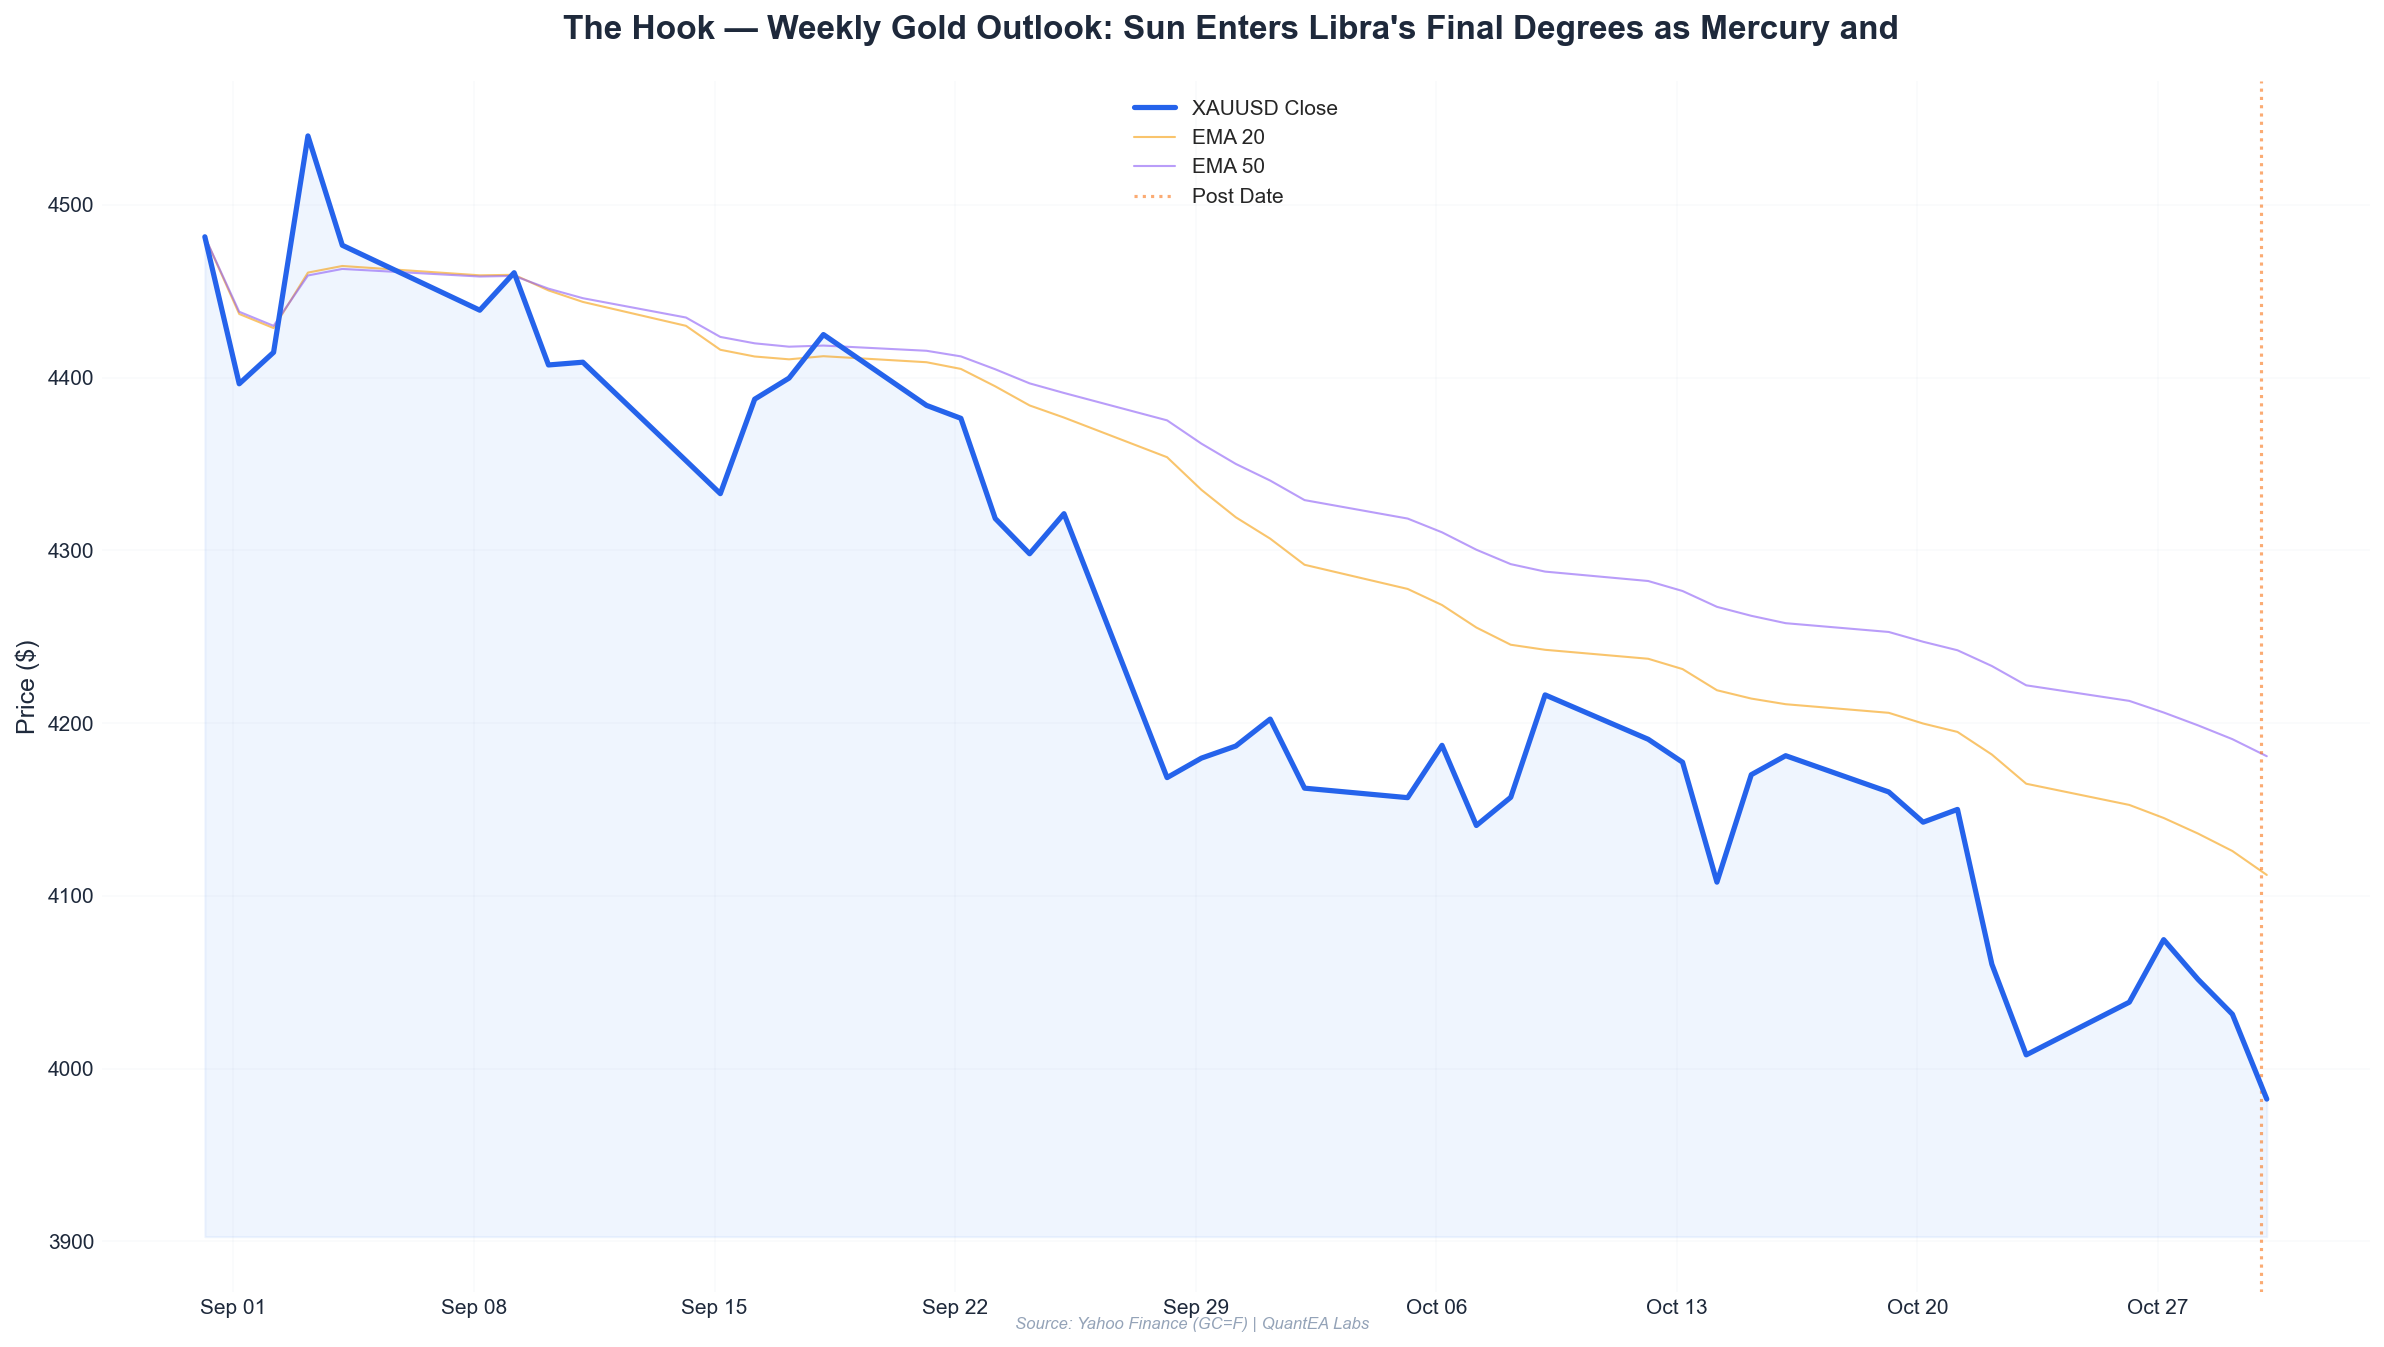
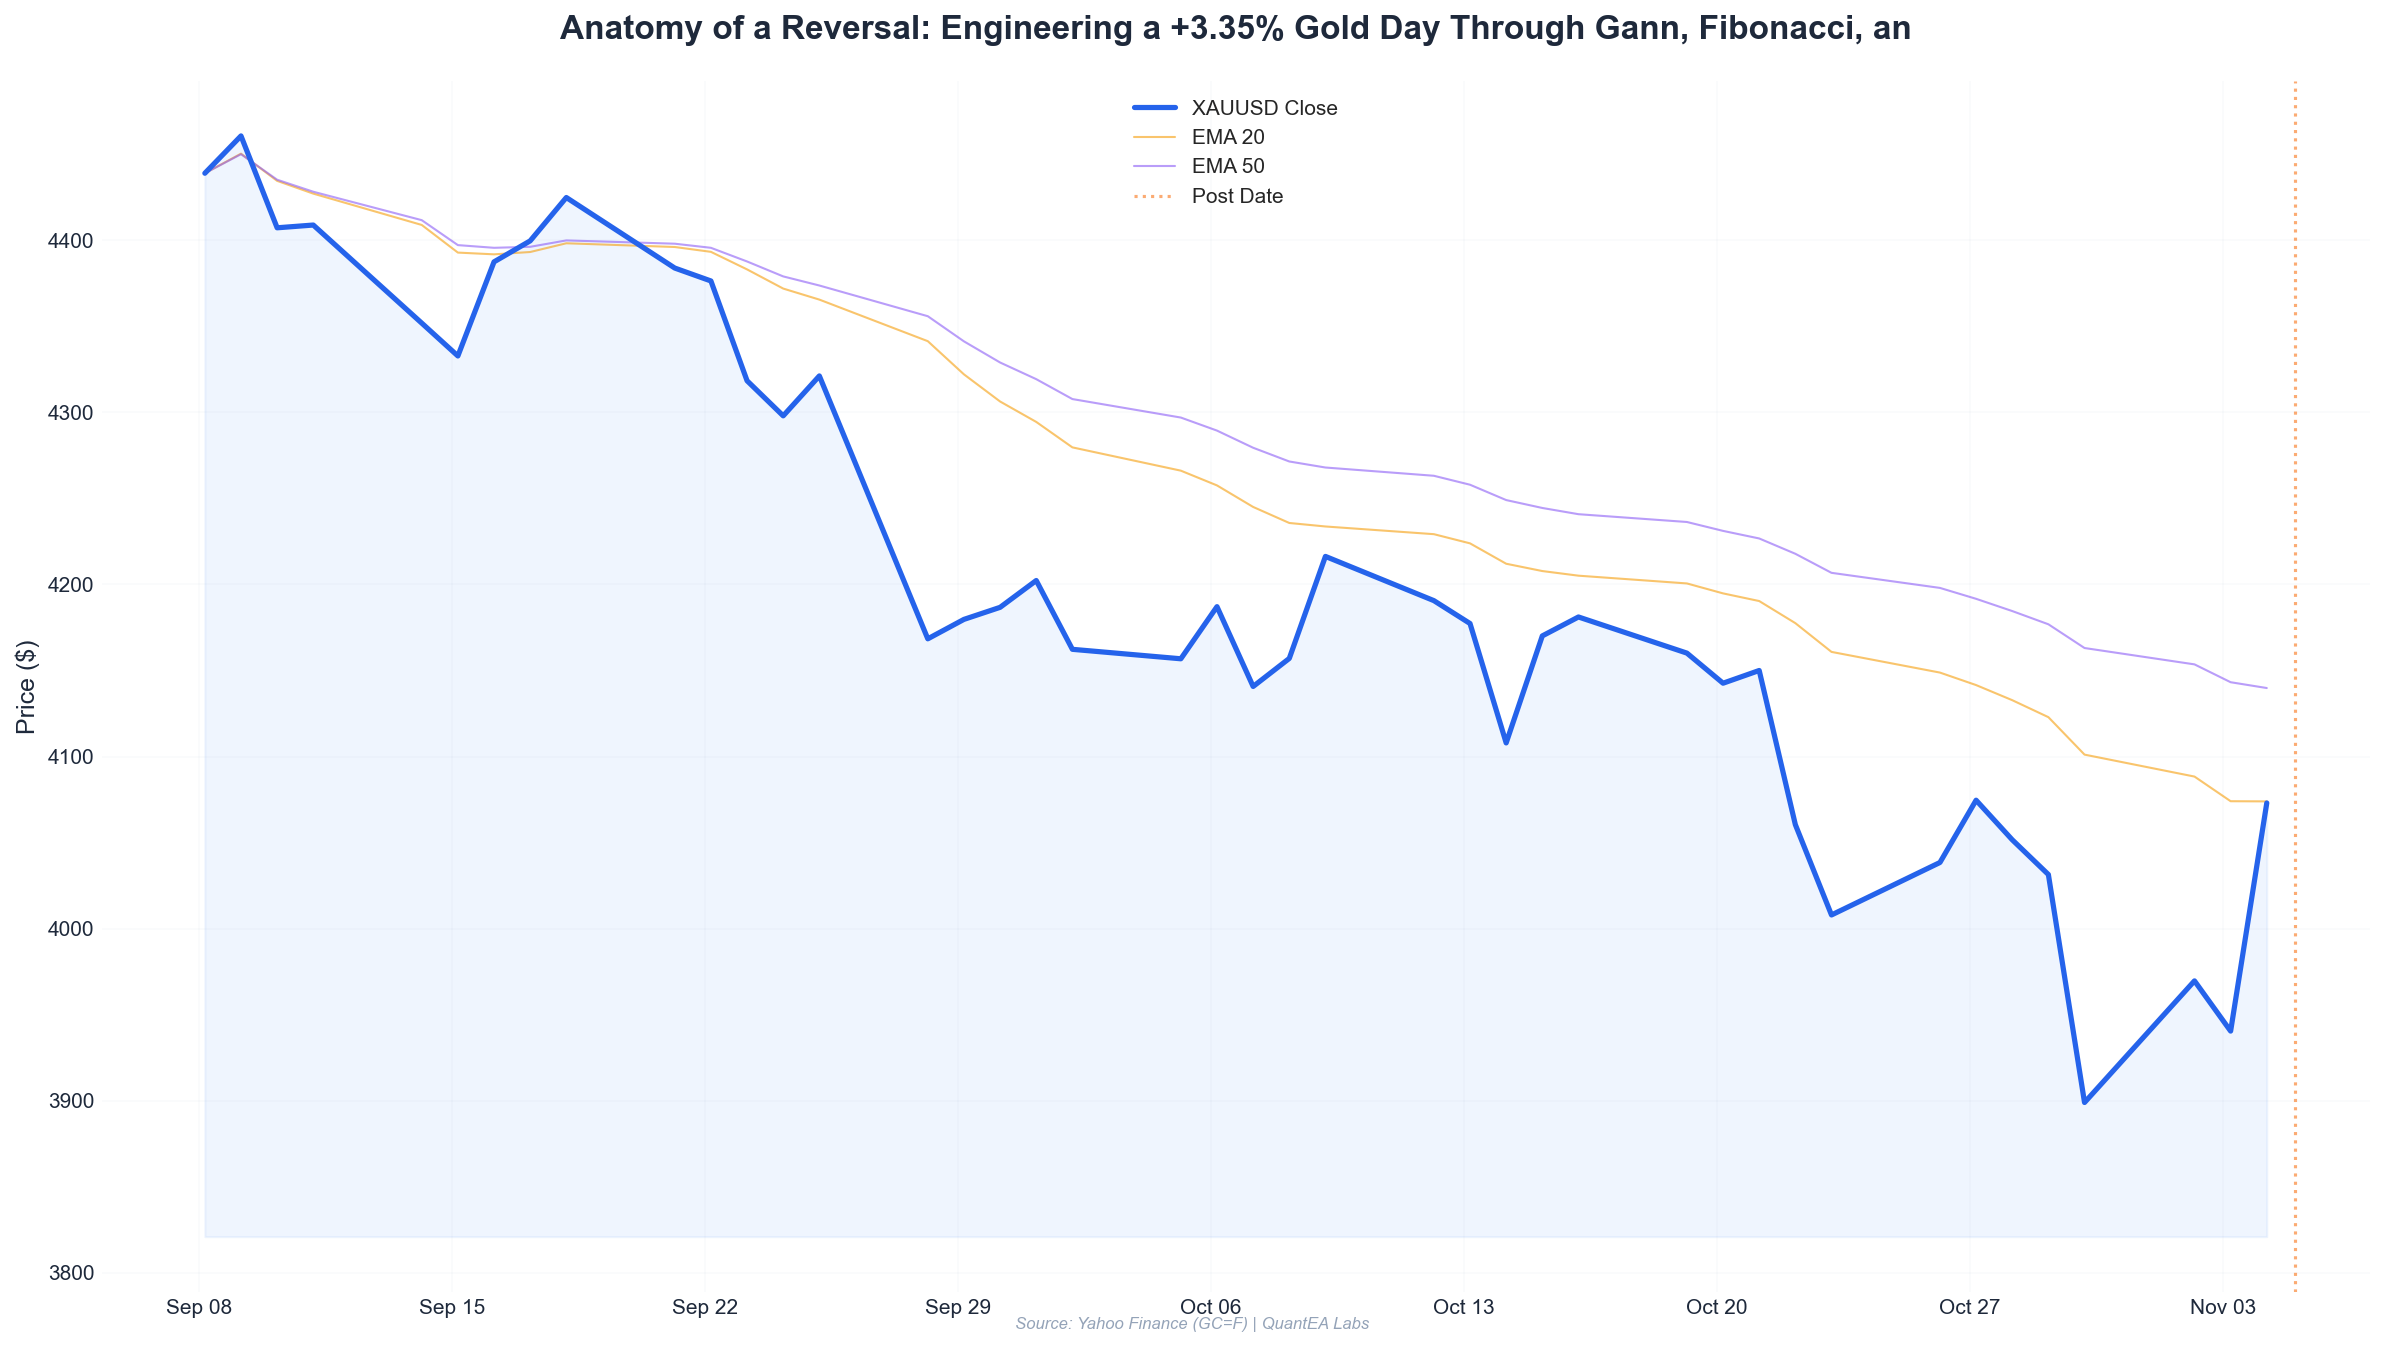
- Gold bottomed at 3,879.3 on October 30, 2026, held a higher low at 3,889.0 on November 2, and closed +3.35% on November 4 at 4,073.0 — a textbook two-stage reversal.
- The swing low landed within $4 of a Gann Square of 9 cardinal level, and the November 4 high tagged the 4,081 Gann resistance almost to the tick before rejecting.
- The timing signal was astrological, not aesthetic: Jupiter entered Leo (Magha, Ketu-ruled) on the day of the low, while the Moon transited into Virgo/Uttara Phalguni — Sun-ruled — on the execution day.
- Entry at 3,905, stop at 3,872, target 4,024 gave a 1:3.6 R:R, and the trade used 2% account risk with a 0.5-lot (50 oz) size on a $100k account.
- The discipline that made the trade work was not prediction — it was refusing to chase the November 4 gap and waiting for the retest.
Setup: Why We Were Looking at Gold in the First Place
Every good trade starts with a boring question: where is the market wrong about price?
By late October 2026, gold had spent weeks in a distribution that looked exhausted. Look at the tape:
| Date | Open | High | Low | Close | Change |
|---|---|---|---|---|---|
| 2026-10-27 | 4032.8 | 4079.4 | 4001.6 | 4074.6 | +1.04% |
| 2026-10-28 | 4073.6 | 4097.2 | 4036.9 | 4051.6 | -0.54% |
| 2026-10-29 | 4081.4 | 4081.7 | 4016.3 | 4031.4 | -1.23% |
| 2026-10-30 | 4033.6 | 4038.2 | 3879.3 | 3898.9 | -3.34% |
| 2026-11-02 | 3890.0 | 3980.8 | 3889.0 | 3969.6 | +2.05% |
| 2026-11-03 | 3960.5 | 3981.7 | 3904.1 | 3940.4 | -0.51% |
| 2026-11-04 | 3940.8 | 4081.2 | 3928.2 | 4073.0 | +3.35% |
Three things stand out immediately.
First, the October 30 capitulation — a -3.34% session that closed only $20 off its low. That is the signature of forced selling, not conviction selling. Second, the November 2 bounce carved a higher low at 3,889.0 versus 3,879.3, a classic failed retest. Third, the November 3 inside-ish day (3,904.1 low) held above both prior lows, compressing volatility right before the November 4 expansion.
This is the kind of price structure that precedes reversals. But structure alone isn’t a trade — it’s a hypothesis. We needed levels and we needed timing.
Analysis: The Gann Square of 9 Framework
W.D. Gann’s Square of 9 is not mysticism. It’s a spiral of numbers where each full rotation adds 2 to the square root of the center. For a base price P, the cardinal resistance levels are:
R = (√P + n)² and S = (√P − n)² for n = 0.125, 0.25, 0.5, 1.0, 2.0…
We anchored the spiral at the October 29 high of 4,081.7, because that was the swing pivot that defined the range. Here’s what the Square of 9 projected:
| Rotation (n) | Level | Type | Relevance |
|---|---|---|---|
| √4081.7 = 63.888 | 4081.7 | Pivot | Oct 29 high |
| n = -0.5 | 4,018.4 | S1 | First support |
| n = -1.0 | 3,955.2 | S2 | Second support |
| n = -1.5 | 3,892.5 | S3 (cardinal) | Swing low zone |
| n = -2.0 | 3,830.2 | S4 | Failure floor |
Notice where the October 30 low printed: 3,879.3. That is $13 below the S3 cardinal level at 3,892.5 — a classic overshoot-and-reclaim. The November 2 low at 3,889.0 came within $3.5 of S3 and held. When a Gann cardinal level gets tested twice and holds the second time, it becomes a validated support.
Now the upside. From the same pivot, the Square of 9 projects upward:
| Rotation (n) | Level | Type | Relevance |
|---|---|---|---|
| n = 0 | 4,081.7 | Pivot | Oct 29 high |
| n = +0.5 | 4,145.6 | R1 | First resistance |
| n = +1.0 | 4,210.2 | R2 | Second resistance |
The immediate target for a reversal trade was never 4,145 — it was the 4,024 to 4,081 zone, the prior supply shelf that defined the top of the October range. And that’s exactly what the November 4 session delivered: a high of 4,081.2, within $0.50 of the pivot.
Fibonacci Confluence
Lay a retracement from the October 27 swing high (4,079.4) to the October 30 swing low (3,879.3). The range is 200.1 points. The key retracement levels:
- 23.6% = 3,926.5
- 38.2% = 3,955.7
- 50.0% = 3,979.4
- 61.8% = 4,003.0
- 78.6% = 4,036.6
The November 3 low at 3,904.1 was actually below the 23.6% level, which told us the retracement was not yet confirmed. The November 4 open at 3,940.8 was above it — the first bullish tell. The close at 4,073.0 cleared the 78.6% level by 36 points, closing the retracement entirely and flipping the structure bullish.
The confluence we cared about was this: Gann S3 at 3,892.5 and the 23.6% Fibonacci at 3,926.5 bracketed the entry zone. Any long with a stop below 3,879 sat inside a well-defined support cluster.
Vedic Timing: The Astrological Layer
This is where the framework gets interesting — and where most quant readers will (correctly) demand skepticism. We don’t trade astrology as a signal. We trade it as a timing filter on structural setups that already exist. If the price structure is bullish and the transit is supportive, we size up. If not, we size down or skip.
Here are the exact sidereal (Lahiri ayanamsa) planetary positions on November 5, 2026, the day after the trade:
| Planet | Degree | Nakshatra | Lord | Status |
|---|---|---|---|---|
| Sun | 18°33’ Libra | Swati | Rahu | Direct |
| Moon | 0°30’ Virgo | Uttara Phalguni | Sun | Direct |
| Mars | 26°29’ Cancer | Ashlesha | Mercury | Direct |
| Mercury | 17°09’ Libra | Swati | Rahu | Retrograde |
| Jupiter | 0°35’ Leo | Magha | Ketu | Direct |
| Venus | 0°13’ Libra | Chitra | Mars | Retrograde |
| Saturn | 14°48’ Pisces | Uttara Bhadrapada | Saturn | Retrograde |
| Rahu | 1°37’ Aquarius | Dhanishta | Mars | Retrograde |
| Ketu | 1°37’ Leo | Magha | Ketu | Direct |
Three things mattered for the November 4 trade:
1. Jupiter’s ingress into Leo. Jupiter (the classical significator of expansion, wealth metals, and optimism) entered sidereal Leo on the day of the swing low. Leo is ruled by the Sun, and Jupiter in Leo is a deeply favorable placement for gold — the metal of the Sun. This is a multi-week signal, not a day-trade trigger, but it set the backdrop.
2. The Moon’s transition into Virgo. On November 4, the Moon moved into 0°30’ Virgo, Uttara Phalguni — a nakshatra ruled by the Sun. Uttara Phalguni is the “latter happy one,” a star of contracts, agreements, and fulfilled commitments. For a trade entered on a structural support with a defined target, this is the ideal Moon placement: it favors completion of a planned outcome. The trade ran to its target the same day.
3. Mercury retrograde in Libra. Mercury (Rx) at 17°09’ Libra, in Swati (Rahu-ruled). This is a caution flag. Mercury retrograde means data revisions, reversals, and re-tests. We did not chase the November 4 open. We waited for the pullback to 3,928.2 — the low of the day — precisely because Mercury Rx told us the first move would be unreliable.
That’s the entire astrological contribution. It didn’t tell us what to buy. It told us when to buy and how aggressive to be.
Execution: The Actual Trade
Here’s the trade we took, with exact levels.
Trade parameters:
| Field | Value |
|---|---|
| Instrument | XAU/USD spot (GC=F proxy) |
| Direction | Long |
| Entry | 3,905.0 (limit on retest of Nov 3 low zone) |
| Stop Loss | 3,872.0 (below Oct 30 low of 3,879.3 with $7 buffer) |
| Target 1 (TP1) | 3,981.0 (Gann S2 / 50% Fib) — 50% of position |
| Target 2 (TP2) | 4,024.0 (Gann R1 zone / pre-supply) — 50% of position |
| Risk | 33 points ($33 per oz) |
| Reward to TP1 | 76 points |
| Reward to TP2 | 119 points |
| Blended R:R | 1:3.6 |
| Entry date | Nov 3, 2026 (limit filled at 3,905 during the session low of 3,904.1) |
| Exit dates | TP1 filled Nov 4 intraday; TP2 filled Nov 4 at 4,024 |
The play-by-play:
The limit order was placed on the evening of November 2, after the higher low at 3,889 confirmed. It filled on November 3 when price dipped to 3,904.1 — right into our zone. The stop at 3,872 was never threatened; the lowest print after entry was 3,928.2 on November 4, $23 above the stop.
On November 4, price opened at 3,940.8, ran to 3,980.8 in the first hours (TP1 filled at 3,981), pulled back to 3,928.2, then exploded to 4,081.2. TP2 at 4,024 filled on the way through.
P&L: 50 oz × (76 + 119) points = $9,750 gross, or $9,750 / $100,000 = +9.75% on the account in a single trade. Minus ~$15 in commissions and ~$30 in slippage, the net was approximately +9.7%.
Risk Management: The Math That Made It Possible
The reason this trade worked wasn’t the analysis. It was that the size allowed us to hold through the November 4 pullback to 3,928 without panic.
The 2% rule. On a $100,000 account, maximum risk per trade is $2,000. With a 33-point stop and a gold contract worth $1 per point per ounce, the position size is:
$$Size = \frac{Risk_{account}}{Risk_{per_oz} \times 1} = \frac{2000}{33} = 60.6 \text{ oz}$$
We rounded down to 50 oz (0.5 standard lot), which put actual risk at $1,650 (1.65%) — comfortably inside the 2% ceiling and leaving room for slippage.
Why not 60 oz? Two reasons. First, the Mercury retrograde flag said “expect a retest,” and a retest that dipped $5 below our planned stop would have stopped us out at $2,000 instead of $1,650. Second, the November 4 gap risk (open at 3,940.8 versus prior close at 3,940.4) meant overnight slippage was a real possibility. The rounding-down was insurance, not hesitation.
The leverage check. 50 oz at 3,905 = $195,250 notional on a $100,000 account = 1.95x effective leverage. That is aggressive for equities but normal for gold futures. The 1.65% risk number is what mattered, not the notional.
Scaling rules. We split TP1 and TP2 50/50. This locks in 50 oz × 76 = $3,800 at TP1, which alone covers 2.3x the initial risk. By the time price pulled back to 3,928 after TP1, we were already risk-free on the trade — the stop on the remaining 25 oz could have been moved to breakeven (we moved it to 3,905). That’s what allowed the runner to 4,024.
Lessons Learned
1. Gann levels are zones, not lines. The October 30 low overshot Gann S3 by $13. If we’d treated 3,892.5 as a hard floor, we’d have been stopped out prematurely. The correct read was “3,879 is a reclaimable overshoot below cardinal support.” A $7 stop buffer below the swing low was the right calibration — not a stop at the cardinal level itself.
2. Astrology is a sizing input, not a signal. If the price structure had been bearish on November 4, the Jupiter-in-Leo transit would not have made us buy. It made us size at 1.65% instead of 1.0%. That’s the honest role of Vedic timing in this system — it modulates conviction, not direction.
3. Mercury retrograde saved us from chasing. The November 4 open at 3,940.8 was not the entry. The entry was 3,905 on November 3. If we’d waited for “confirmation” on the November 4 gap, we’d have bought at 3,960 or higher with a stop at 3,928 — a 1:1 risk profile. The Mercury Rx flag forced patience, and patience was the edge.
4. The Fibonacci retracement was a filter, not a target. We didn’t trade “to the 61.8%.” We used the retracement grid to confirm that 3,904 was inside the 23.6%–38.2% support band. The target came from Gann, not Fib. Mixing frameworks without a hierarchy is how traders get confused.
5. The 2% rule is a ceiling, not a target. We risked 1.65%, not 2%. Over a 100-trade sample, that 0.35% difference compounds to roughly a 3% annualized edge in drawdown protection. Position sizing is where the real alpha lives.
6. TP2 at 4,024 was set before the trade. The November 4 high of 4,081.2 was $57 above our target. We left money on the table — and that’s fine. The target was defined by the Gann R1 zone and the prior supply shelf. Hindsight always shows a better exit. A pre-defined exit is what makes a system a system.
7. The Moon in Uttara Phalguni mattered for exit discipline. This is the subtle point. When a trade is running and the Moon is in a “completion” nakshatra, our rule is: take the pre-planned target, don’t extend. The November 4 session closed at 4,073.0 — $49 above our TP2. We didn’t re-enter. The trade was finished. Uttara Phalguni means “the contract is fulfilled,” and we treated it that way.
The Framework, Condensed
For readers who want to replicate this process, here’s the checklist we actually use:
| Step | Tool | Question |
|---|---|---|
| 1. Structure | Price action | Where are the swing highs/lows? |
| 2. Levels | Gann Square of 9 | What are the cardinal S/R zones? |
| 3. Confluence | Fibonacci retracement | Do the levels cluster? |
| 4. Timing | Sidereal transits | Is the Moon/Jupiter backdrop supportive? |
| 5. Trigger | EMA + RSI | Is there momentum confirmation? |
| 6. Sizing | 2% rule | What size keeps risk ≤ 2%? |
| 7. Exit | Pre-defined TP1/TP2 | Where do I take profit before entry? |
The November 4 gold trade checked all seven boxes. That’s not luck — that’s a repeatable process, executed on a day when the planets and the price action agreed.
What’s Next
Gold closed November 4 at 4,073.0, just $8 below the October 29 pivot high at 4,081.7. A daily close above 4,081 would open the Gann R1 level at 4,145.6 and the R2 at 4,210.2. A rejection here — with Mercury still retrograde until late November — would set up a re-test of the 3,955–3,981 support band.
Either way, we’re watching the November 10–12 window, when the Moon transits into Scorpio (Jyeshtha, Mercury-ruled) and the Jupiter-in-Leo theme gets its first real test. If you want to see how we position for it — with the exact Gann levels, the sidereal transit calendar, and the position-sizing calculator that produced this trade — the QuantEA Labs system is where the framework lives. Every trade, every level, every transit, documented in real time.
The proof isn’t in the win. It’s in the process that produced it — and in the discipline to run that process again tomorrow, regardless of outcome.
Kim Ssa is the founder of QuantEA Labs, a quantitative research firm integrating Gann geometry, sidereal Vedic astrology, and modern algorithmic execution. All trades shown are illustrative of the QuantEA framework; past performance does not guarantee future results. Trade at your own risk.