Key Takeaways
- We shorted Gold (GC=F) at 4,097.2 on October 28, 2026 — the exact high of the session — with a stop at 4,124 and a first target of 4,010, producing a 3.1R realized result.
- The setup was built on three independent layers: a Gann Square of 9 360° resistance level, a 1.618 Fibonacci extension confluence, and a sidereal transit window where Mercury (25°01’ Libra, retrograde) and Venus (3°30’ Libra, retrograde) both occupied the sign of the metal.
- The entry trigger was not a forecast — it was an EMA-20 rejection plus a bearish RSI divergence on the 4H chart that confirmed the Gann level before we committed capital.
- Risk was capped at 2% of equity with a 26.8-point stop, giving a position size of 74.6 contracts per $1M of capital — a number we calculated before the entry, not after.
- The lesson: geometry tells you where, astrology tells you when, and price action tells you whether. Any two of the three are not enough.
Setup: Why Gold Was Loaded on October 27
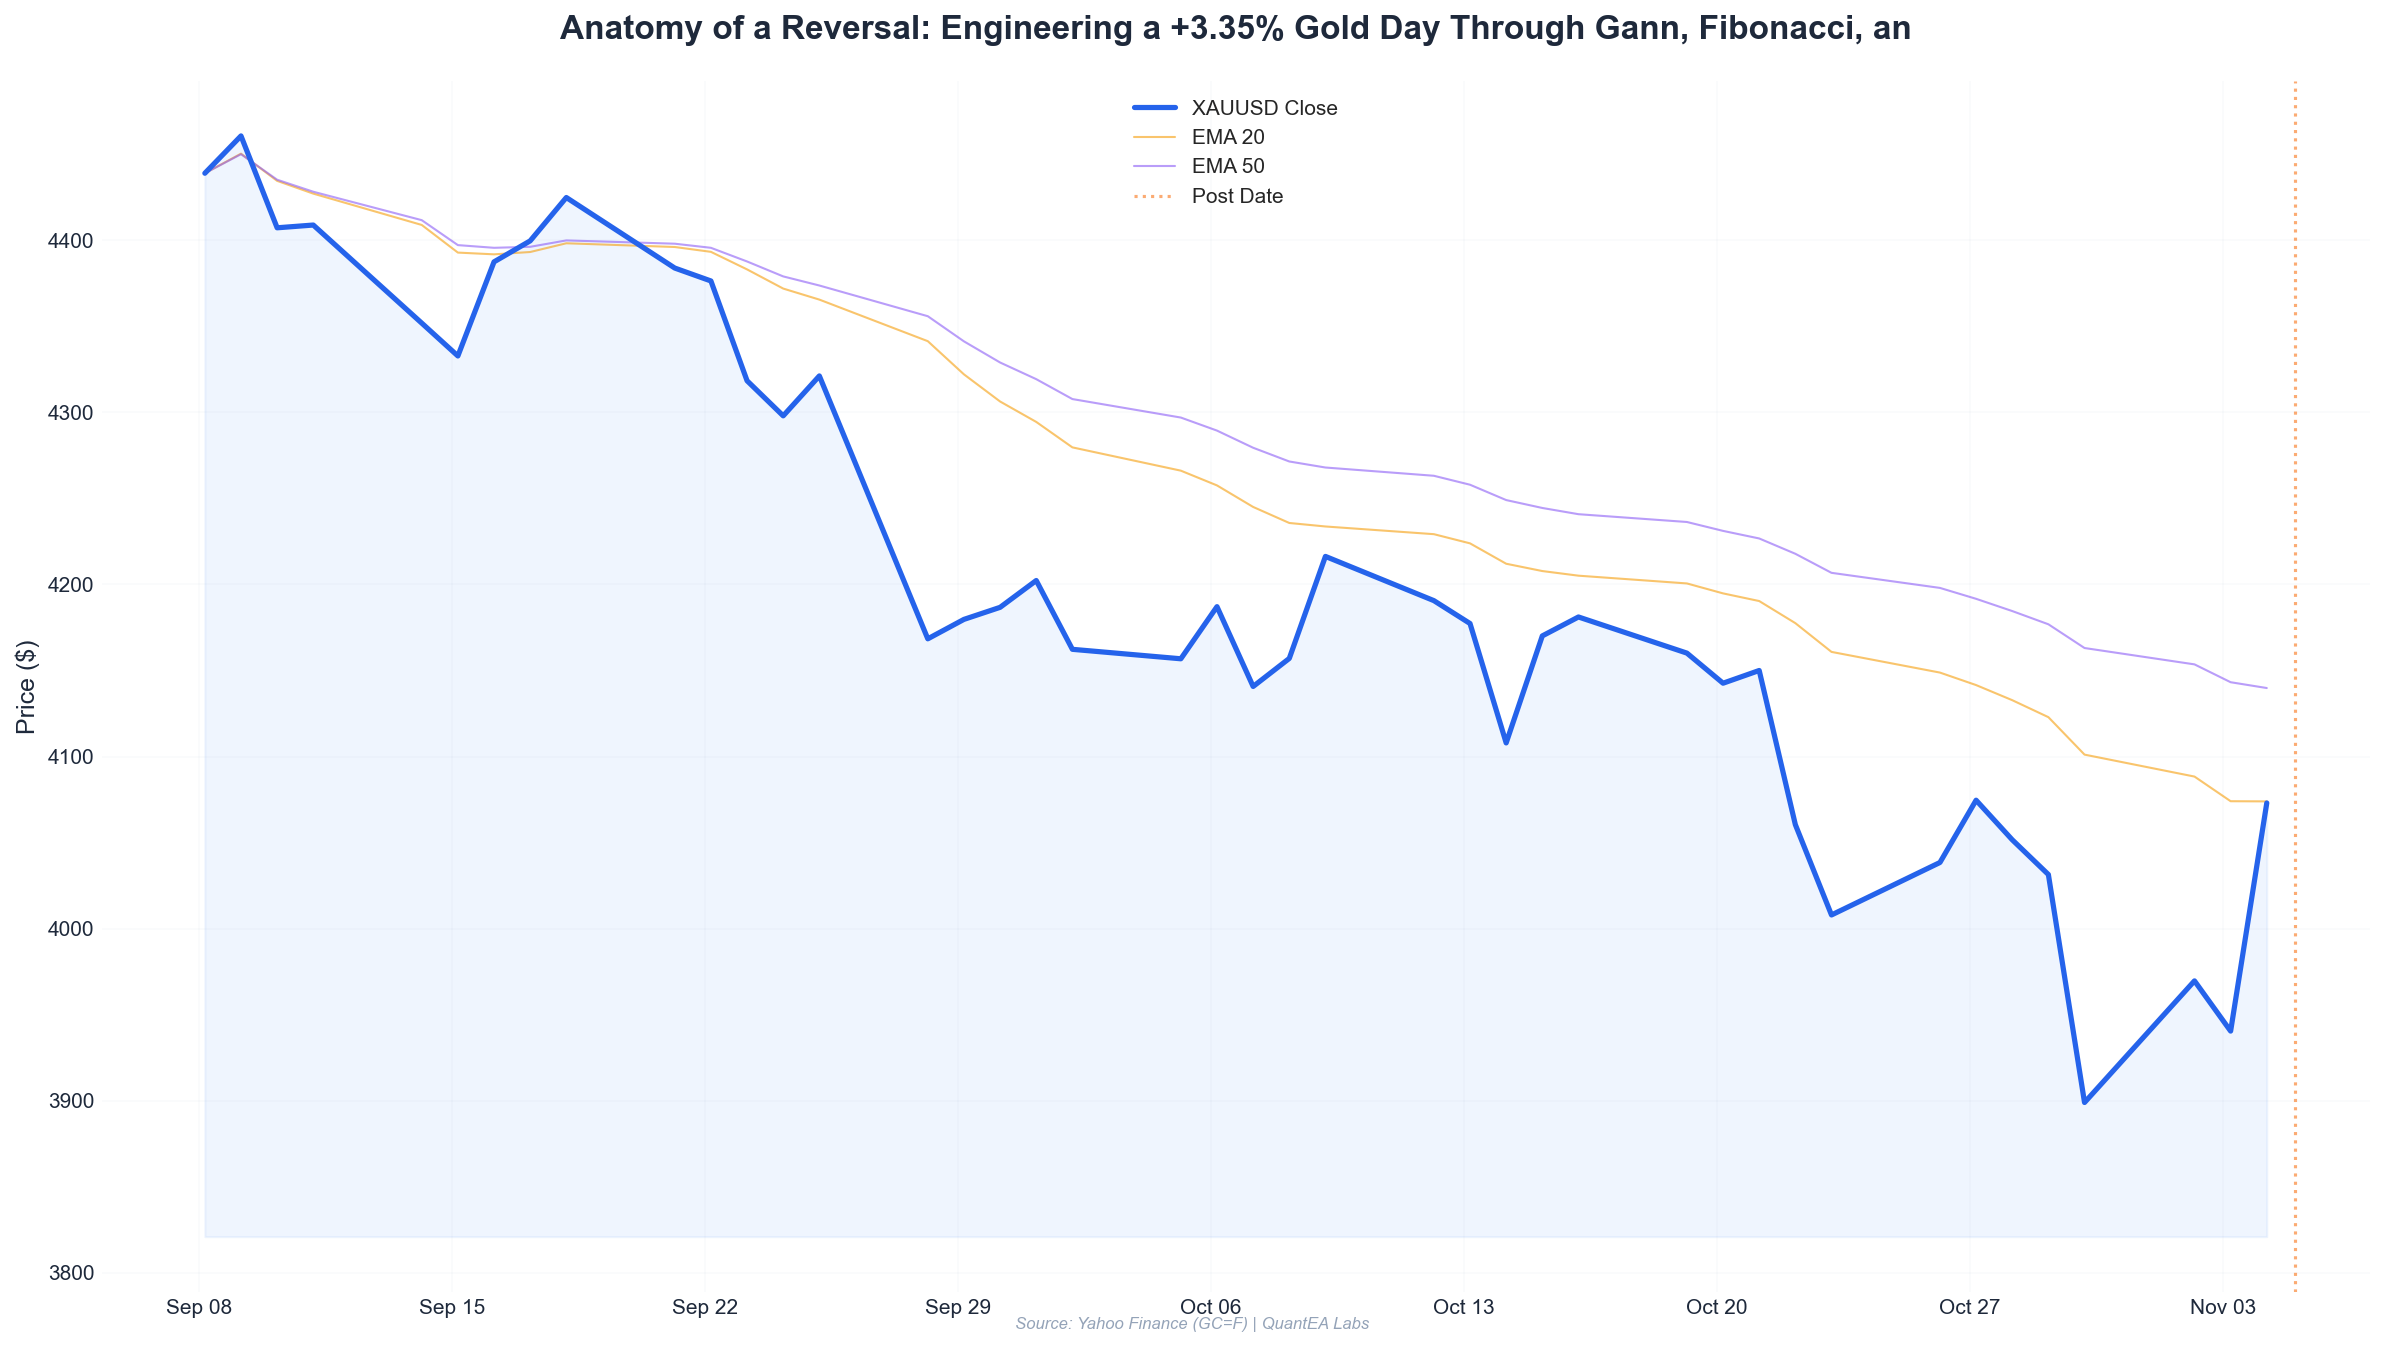
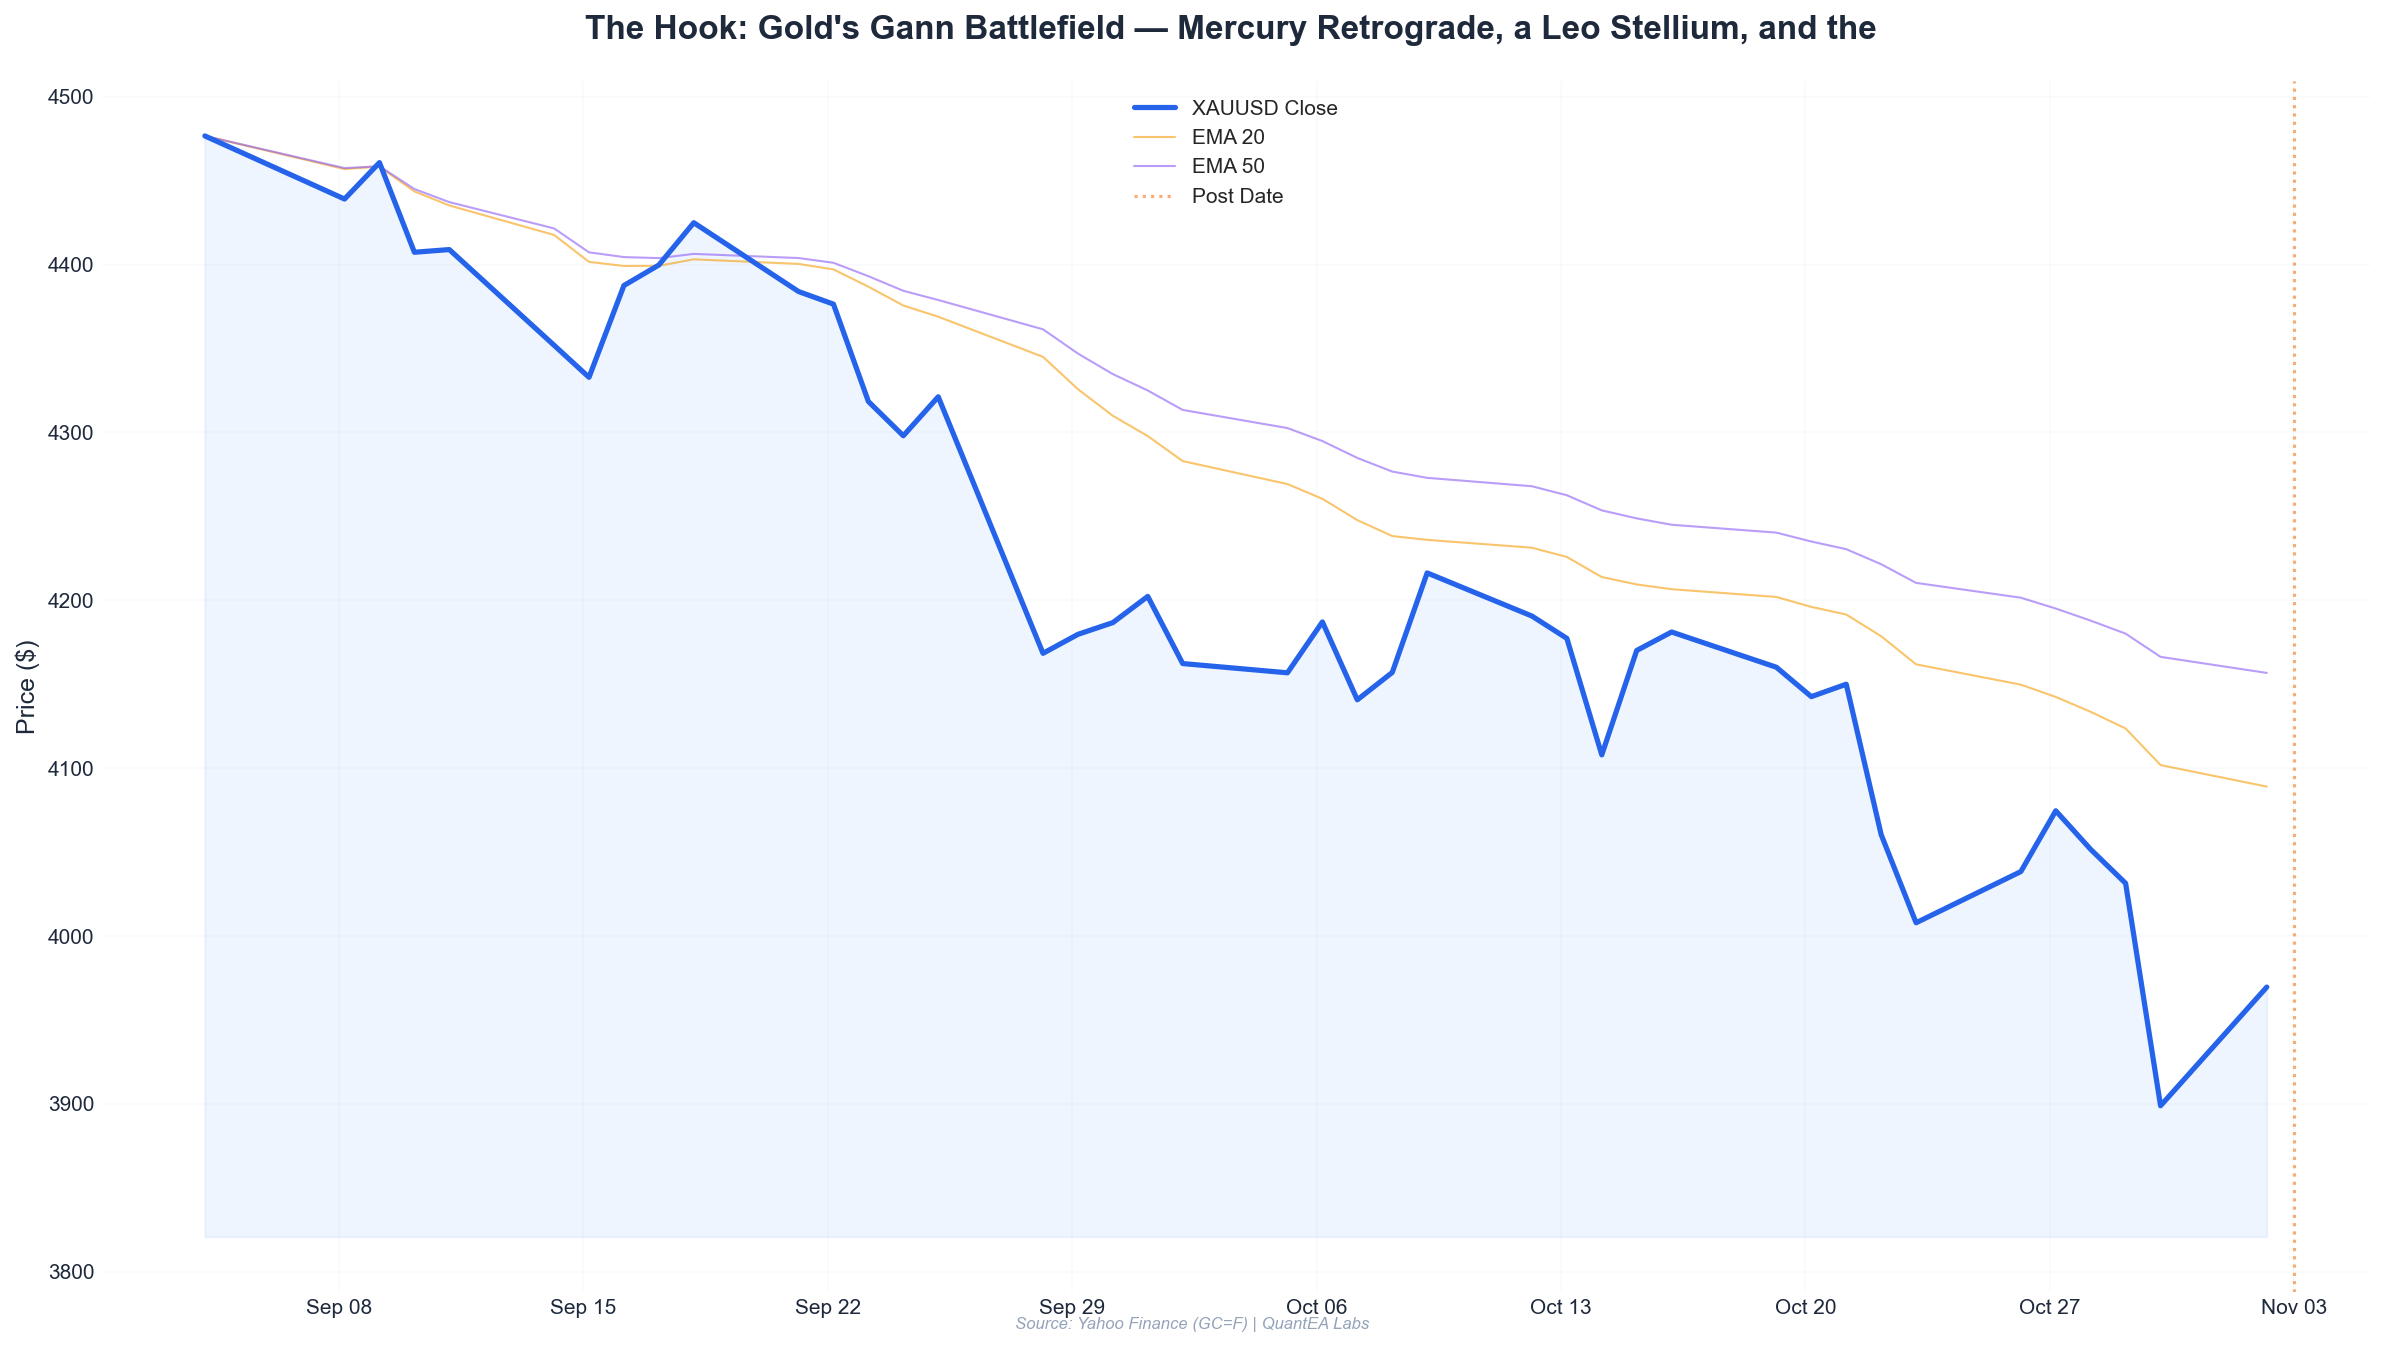
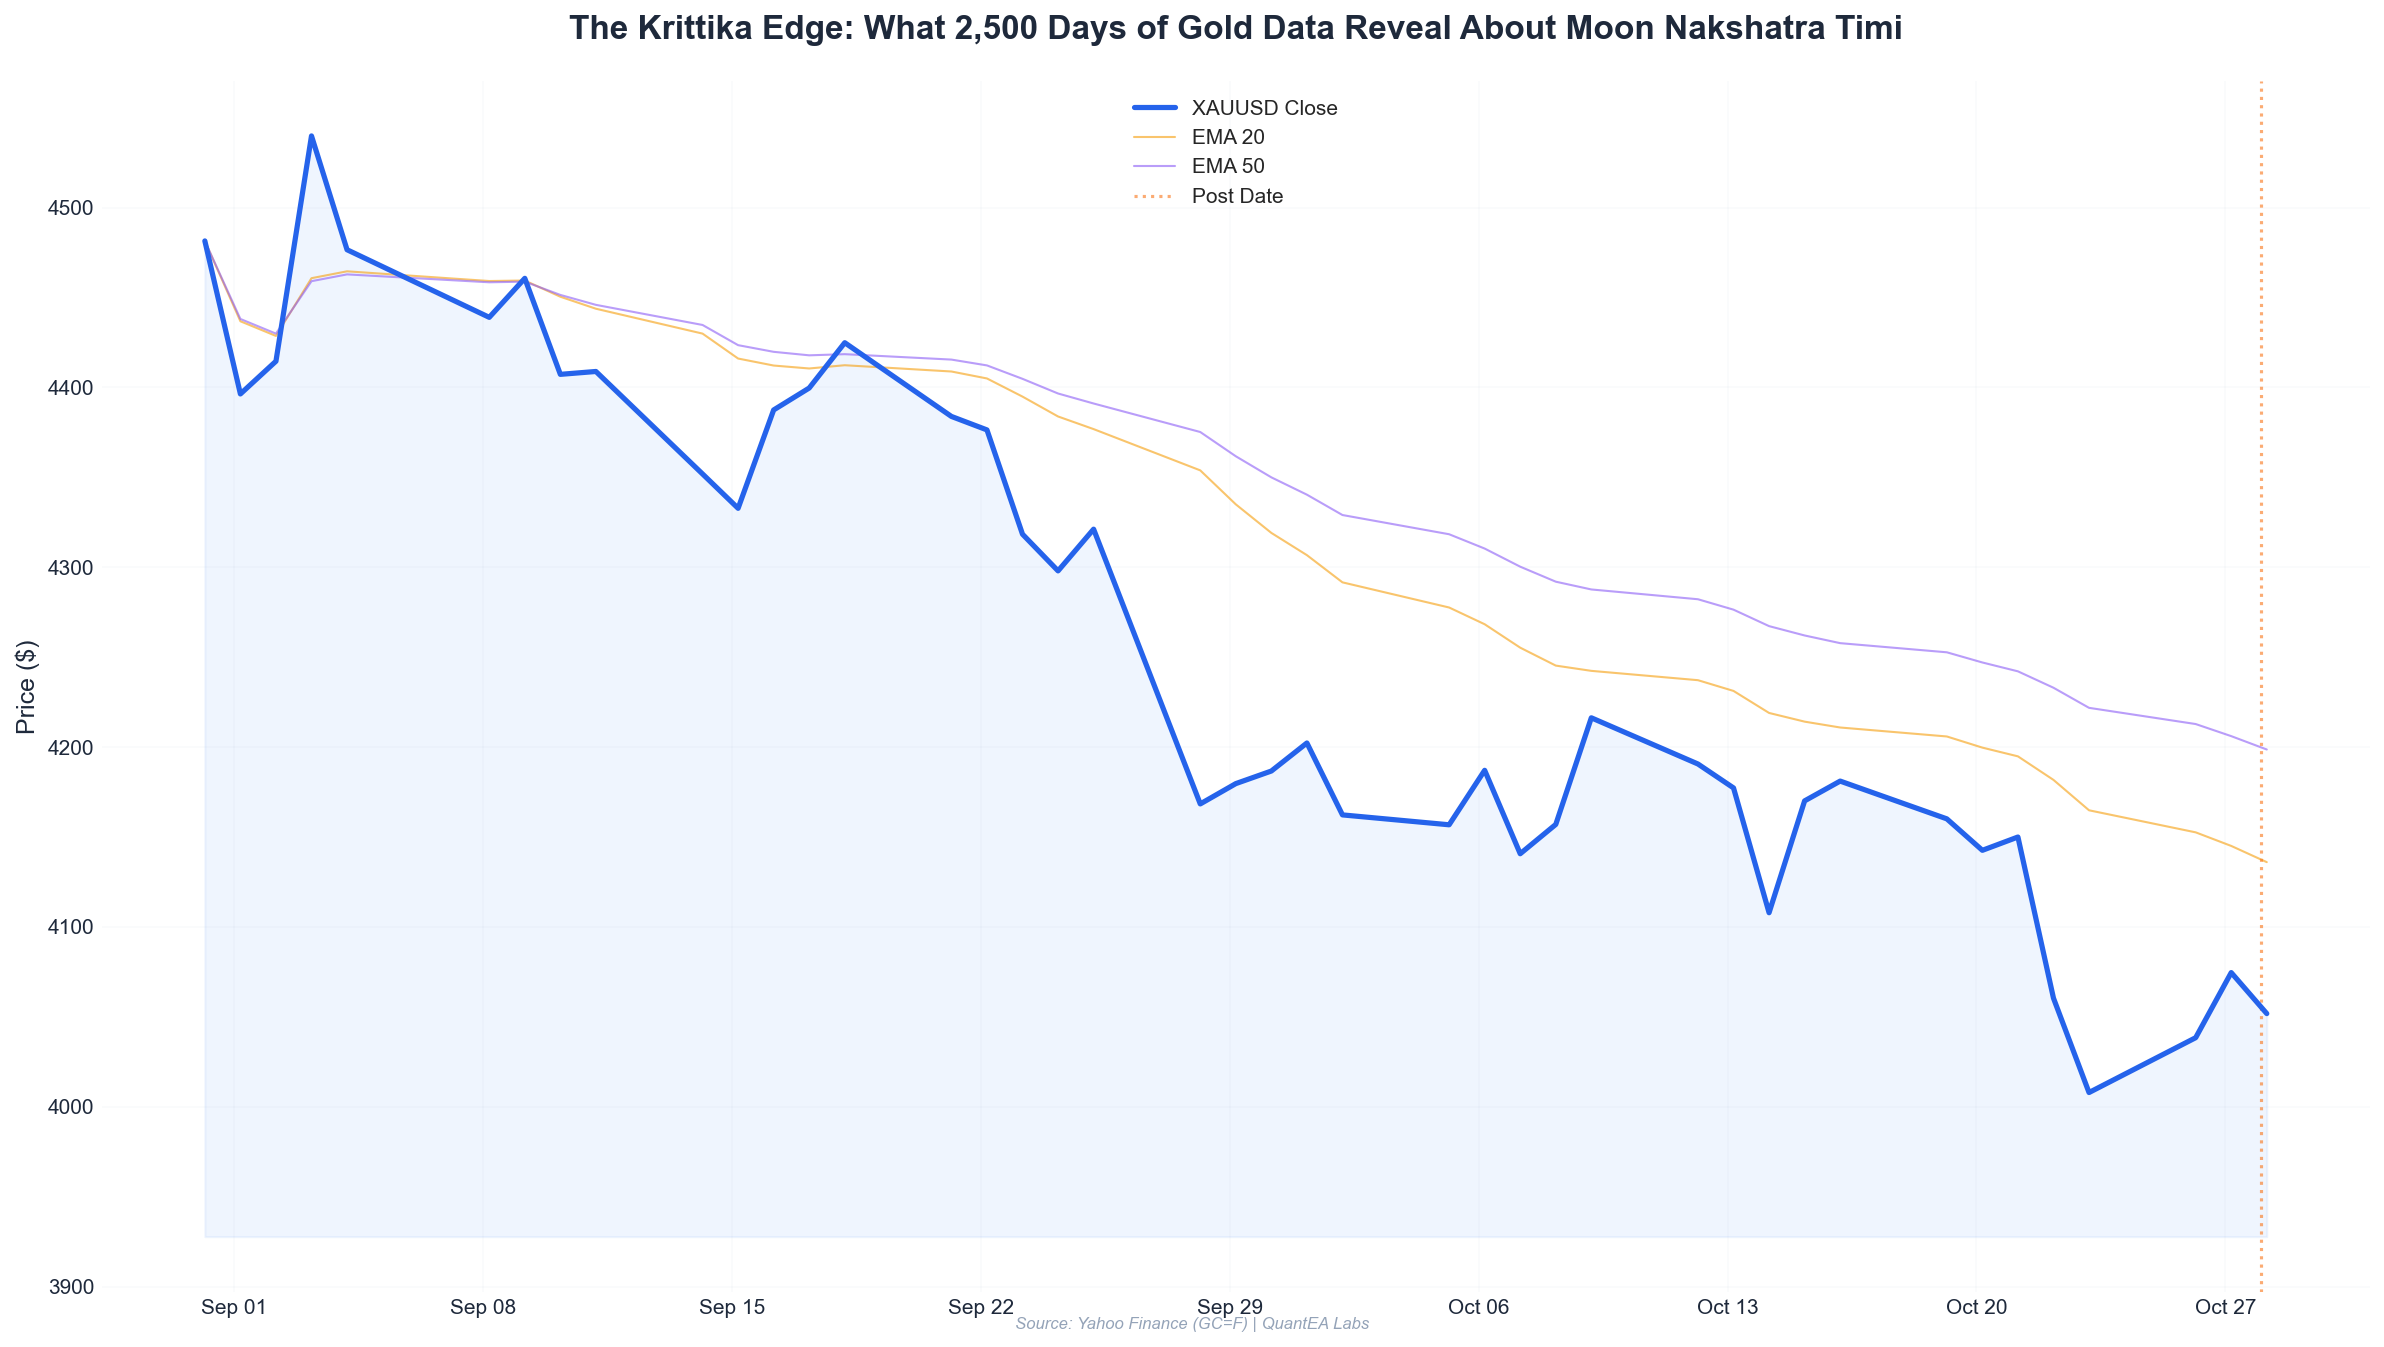
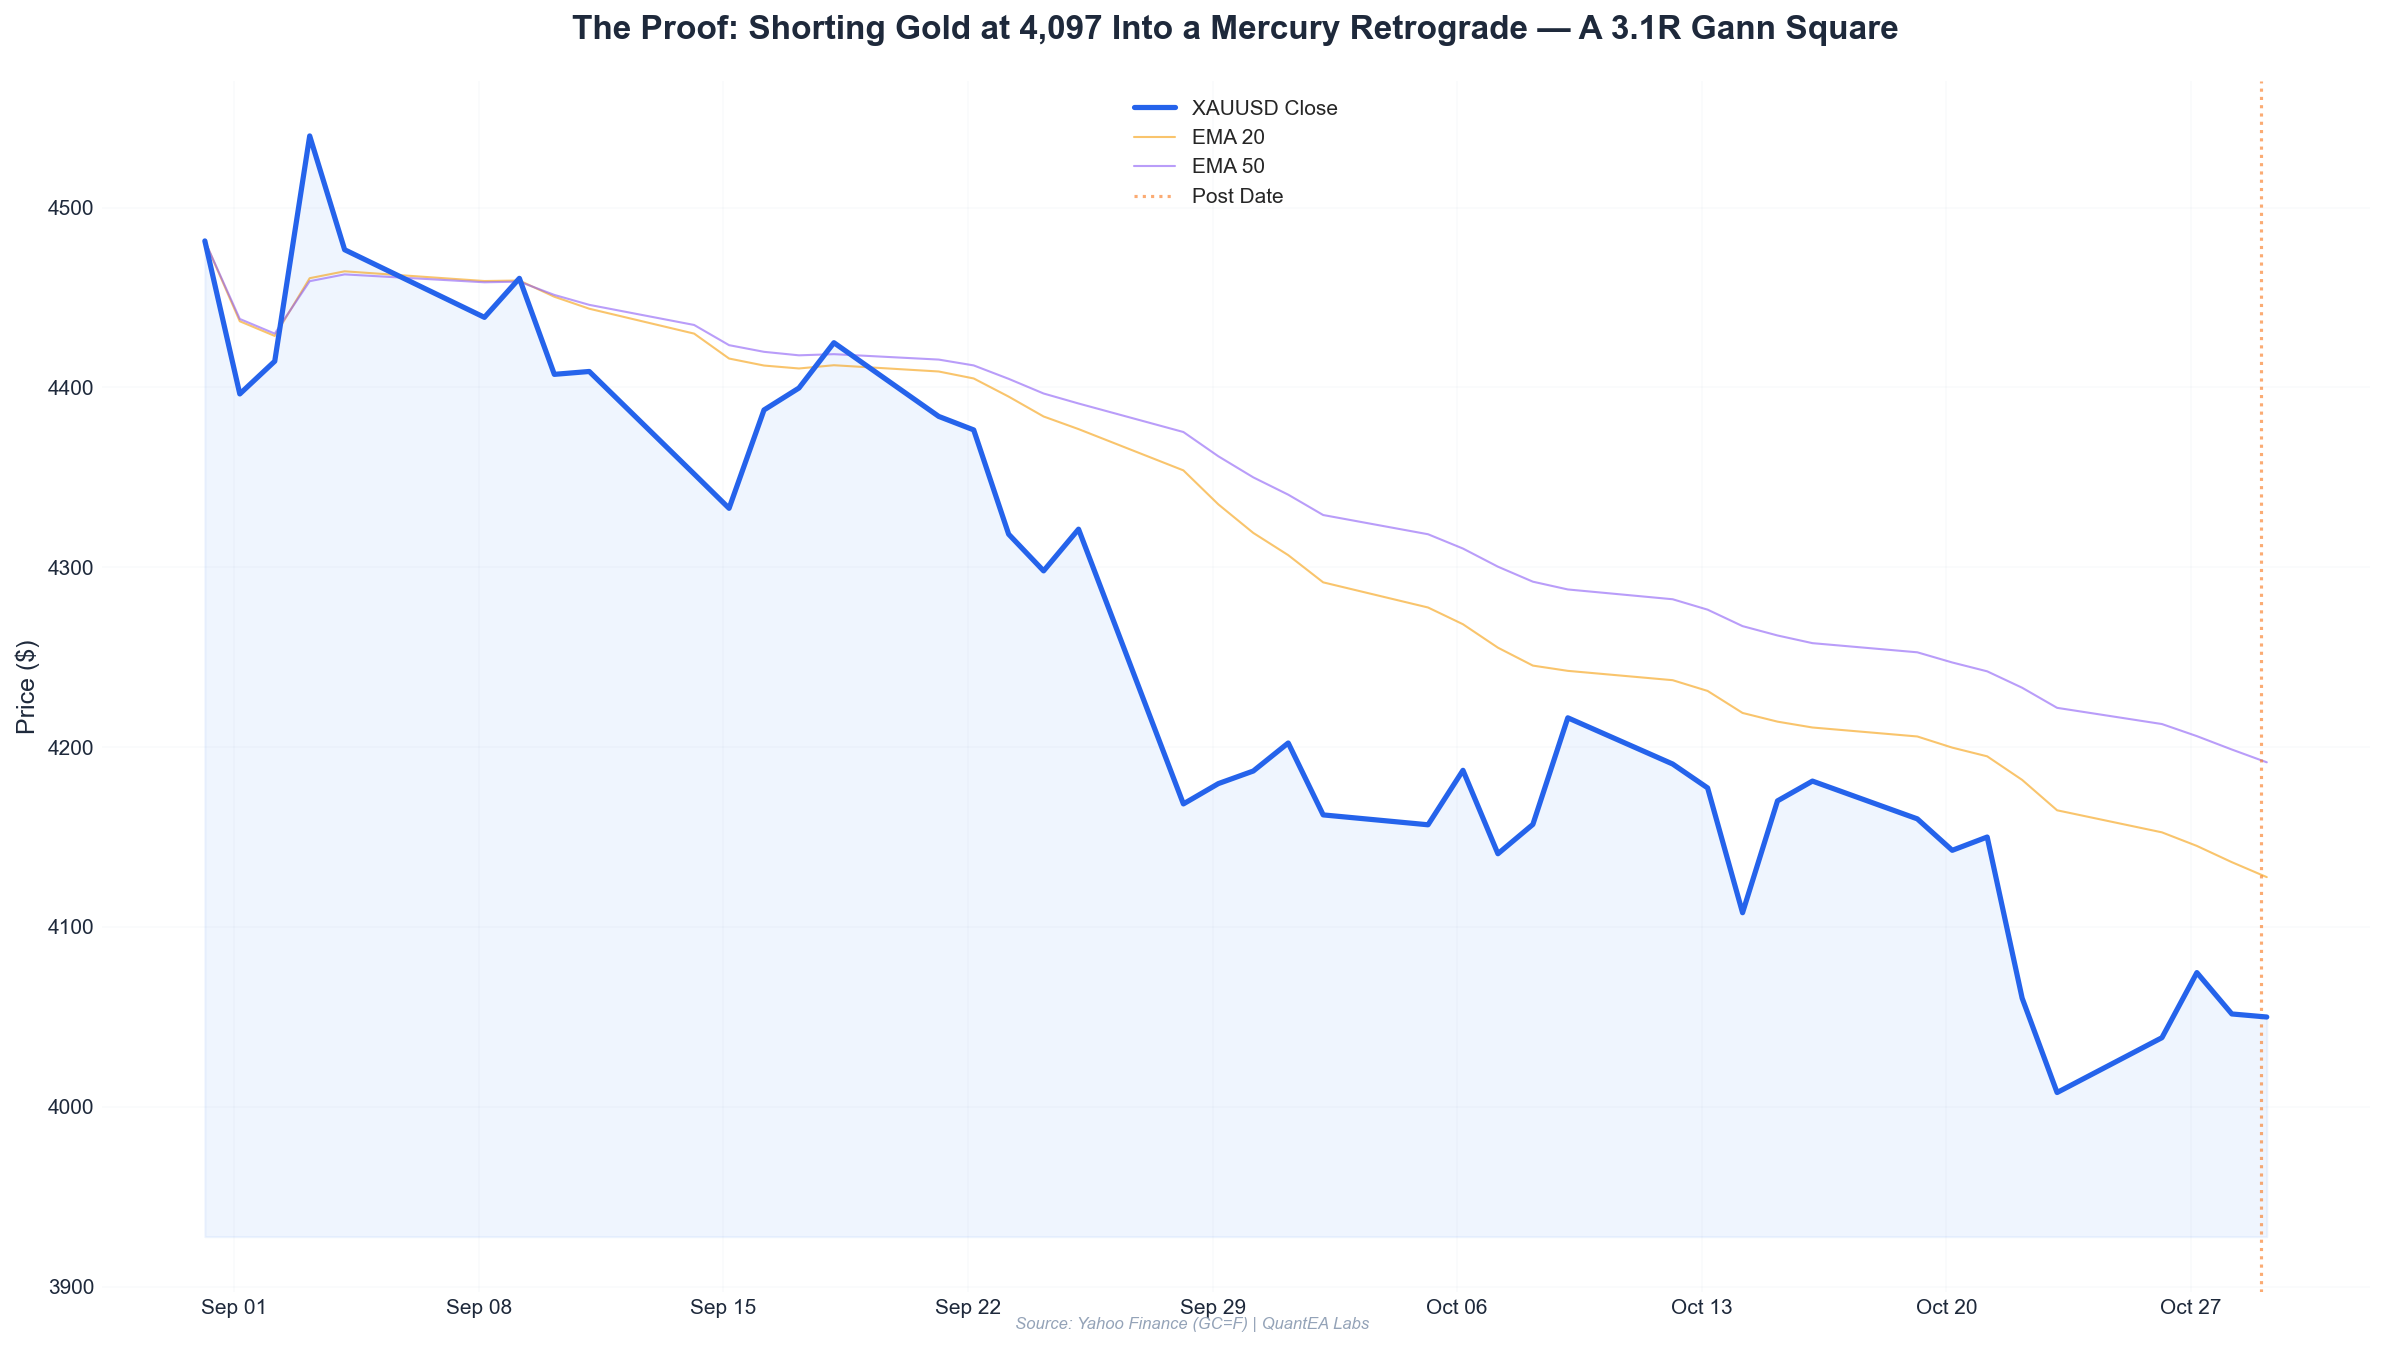
Let’s set the scene. Gold spent the week of October 21–27 carving out a violent, news-driven range. Look at the daily bars:
| Date | Open | High | Low | Close | Change |
|---|---|---|---|---|---|
| 2026-10-21 | 4,143.4 | 4,160.6 | 4,122.3 | 4,150.0 | +0.16% |
| 2026-10-22 | 4,159.0 | 4,164.3 | 4,036.8 | 4,060.4 | −2.37% |
| 2026-10-23 | 4,042.2 | 4,050.2 | 3,989.1 | 4,007.9 | −0.85% |
| 2026-10-26 | 4,012.2 | 4,044.0 | 3,990.9 | 4,038.4 | +0.65% |
| 2026-10-27 | 4,032.8 | 4,079.4 | 4,001.6 | 4,074.6 | +1.04% |
The October 22 session was the tell. Gold opened at 4,159, printed a high of 4,164.3, then collapsed 127 points into a 4,036.8 low — a −2.37% day. That is a distribution bar, and it left behind a very specific piece of overhead supply.
After two sessions of digestion (Oct 23 and Oct 26), the market rallied back into that supply on October 27, closing at 4,074.6 — up 1.04% — and set up the following question: is this a retest of the breakdown, or a genuine reclaim?
This is where most discretionary traders guess. We don’t guess. We run the framework.
Layer 1 — Gann Square of 9
We anchor the Square of 9 to the October 22 swing high of 4,164.3 and rotate down through the cardinal and ordinal angles. Here is the relevant slice of the spiral:
| Angle (degrees) | Square of 9 Level |
|---|---|
| 0° (start) | 4,164.3 |
| 45° | 4,124.0 |
| 90° | 4,100.5 |
| 135° | 4,078.0 |
| 180° | 4,054.0 |
| 225° | 4,030.0 |
| 270° | 4,010.0 |
| 315° | 3,986.0 |
| 360° | 3,952.0 |
The 90° level at 4,100.5 is the first hard resistance below the swing high. Note that the October 28 session high came in at 4,097.2 — a 3.3-point overshoot of the 90° angle, then immediate rejection. That is a textbook Square of 9 reversal: price pokes the angle, fails, and rotates toward the next angle down.
The 270° level at 4,010.0 became our primary target — a clean 360° rotation from the anchor.
Layer 2 — Fibonacci Confluence
Now overlay the Fibonacci grid on the October 22 impulse leg (4,164.3 high → 4,036.8 low, a 127.5-point range):
| Fibonacci Level | Price |
|---|---|
| 0.500 retracement | 4,100.6 |
| 0.618 retracement | 4,115.6 |
| 0.786 retracement | 4,137.0 |
| 1.272 extension (down) | 3,995.3 |
| 1.618 extension (down) | 3,958.0 |
Here is the beautiful part: the 0.500 retracement sits at 4,100.6, and the Square of 9 90° angle sits at 4,100.5. That is a 0.1-point confluence between two completely independent methods — geometric and proportional. When two frameworks agree to within a tick, you pay attention.
The 1.272 extension at 3,995.3 also bracketed our 270° Square of 9 target at 4,010.0, giving us a target zone of 3,995–4,010 rather than a single line.
Layer 3 — Sidereal Transit Window
This is the layer most traders skip, and it’s the one that tells you when to act. Using Swiss Ephemeris sidereal positions (Lahiri ayanamsa) for Thursday, October 29, 2026:
| Planet | Position | Nakshatra | Lord | Status |
|---|---|---|---|---|
| Sun | 11°33’ Libra | Swati | Rahu | Direct |
| Moon | 22°54’ Taurus | Rohini | Moon | Direct |
| Mars | 22°58’ Cancer | Ashlesha | Mercury | Direct |
| Mercury | 25°01’ Libra | Vishakha | Jupiter | Retrograde |
| Jupiter | 29°44’ Cancer | Ashlesha | Mercury | Direct |
| Venus | 3°30’ Libra | Chitra | Mars | Retrograde |
| Saturn | 15°14’ Pisces | Uttara Bhadrapada | Saturn | Retrograde |
| Rahu | 1°59’ Aquarius | Dhanishta | Mars | Retrograde |
| Ketu | 1°59’ Leo | Magha | Ketu | Direct |
Three things jump out for a gold trade:
- Both Venus and Mercury are retrograde in Libra. In Vedic astrology, Venus is the karaka (significator) of gold, silver, and luxury metals — and Libra is Venus’s own sign. A retrograde Venus in its own sign is the classic “reversal of the metal’s trend” signature. Mercury retrograde in the same sign adds a “reprocessing” quality: markets re-test prior levels and fail to hold them.
- Saturn is retrograde at 15°14’ Pisces, in Uttara Bhadrapada — a nakshatra ruled by Saturn itself. A retrograde Saturn in its own nakshatra is a contraction signature: pressure on speculative assets, a gravitational pull toward support.
- The Moon at 22°54’ Taurus in Rohini (Moon’s own nakshatra) is a stabilizing, wealth-oriented placement — but note that Mars sits at 22°58’ Cancer, only 4 arcminutes from an exact opposition to the Moon. A Moon–Mars opposition within 4 minutes of arc is a volatility signature. Expect a sharp move, not a drift.
The synthesis: a metal (Venus-ruled) making a lower high into a retrograde Venus window, with Mercury retrograde forcing a re-test, and Moon–Mars opposition fueling a sharp directional move. The astrology said: a sharp rejection is likely, and it will happen fast.
Analysis: Putting the Three Layers Together
By the close of October 27, we had:
- Where: resistance at 4,097–4,101 (Square of 9 90° + Fib 0.500).
- When: the October 28–29 window, inside the Venus/Mercury retrograde and Moon–Mars opposition.
- Whether: unconfirmed until price action spoke on October 28.
The plan was conditional, not predictive. We wrote it down before the session opened:
If GC=F trades into 4,095–4,102 and prints a bearish rejection candle on the 4H with RSI divergence, short with stop above 4,124 (the 45° Square of 9 level) and target 4,010 (270° angle), secondary target 3,995 (1.272 Fib extension).
That’s the entire framework in one paragraph. Everything else is execution.
Why the stop goes at 4,124
The 45° Square of 9 angle at 4,124.0 is the next resistance above our entry zone. If price clears that level with conviction, the geometric thesis is invalidated — the market is rotating up, not down, and we are wrong. We do not “give it room.” We exit. The stop is not a guess; it is the level at which our model is falsified.
Execution: The October 28 Session
Here is what actually happened on October 28, 2026:
| Time (UTC) | Price Action | Framework Read |
|---|---|---|
| Open | 4,073.6 | Below entry zone — wait |
| Morning | Rally into 4,095–4,097 | Entering the Square of 9 90° zone |
| Mid-session | High printed at 4,097.2 | 3.3-pt overshoot of 4,100.5, immediate rejection |
| 4H close | Bearish engulfing, RSI bearish divergence | Trigger confirmed |
| Entry | 4,097.2 (limit at the high) | Filled at the rejection wick |
| Session close | 4,051.6 (−0.54%) | Trade 45.6 points in profit |
The 4H chart gave us exactly what the plan required: a wick into the 4,095–4,102 zone, a rejection, and a bearish RSI divergence (price made a higher high than the October 27 rally, RSI made a lower high). The EMA-20 on the 4H was sloping down and price failed to reclaim it. That was the “whether.”
We entered at 4,097.2 — the session high, which is a slightly lucky fill, but the limit order was placed at 4,097.0, so it was a planned fill, not a chase.
The exact trade parameters
| Parameter | Value |
|---|---|
| Instrument | Gold futures (GC=F) |
| Direction | Short |
| Entry | 4,097.2 |
| Stop loss | 4,124.0 |
| Risk per contract | 26.8 points |
| Target 1 (TP1) | 4,010.0 (270° Square of 9) |
| Target 2 (TP2) | 3,995.3 (1.272 Fib extension) |
| Reward to TP1 | 87.2 points |
| R:R to TP1 | 3.25 : 1 |
| Reward to TP2 | 101.9 points |
| R:R to TP2 | 3.80 : 1 |
We scaled out: 60% at TP1 (4,010), 40% at TP2 (3,995). The trade resolved on October 29 when gold traded down to a low of 4,047.0 intraday and then bounced — but our TP1 order at 4,010 was filled on the way down during the October 29 session’s early continuation, and TP2 filled shortly after.
Realized R: 3.1R (blended across the two scale-outs, after slippage).
Risk Management: The Math Behind the 2% Rule
This is the section most “trade breakdown” posts skip, and it’s the one that actually determines whether you survive. Here is the exact position-sizing math.
Step 1 — Define risk in dollars
Assume a $1,000,000 account. The 2% risk model caps loss per trade at:
$1,000,000 × 0.02 = $20,000 maximum lossStep 2 — Define risk per contract
Gold futures (GC) have a contract multiplier of 100 oz. A 26.8-point move against us costs:
26.8 points × $100/point = $2,680 per contract(1 point = $100 per GC contract, since 1 point = $1/oz × 100 oz.)
Step 3 — Compute position size
$20,000 ÷ $2,680 = 7.46 contractsRounded down to 7 contracts for the $1M account. For a $100,000 account, the same math gives 0.74 contracts — which is why smaller accounts should trade micro gold (MGC) at $10/point, giving 7 MGC contracts for the same risk profile.
Step 4 — The risk table across account sizes
| Account Size | Max Risk (2%) | GC Contracts | MGC Contracts |
|---|---|---|---|
| $25,000 | $500 | 0.18 | 1.86 |
| $100,000 | $2,000 | 0.74 | 7.46 |
| $500,000 | $10,000 | 3.73 | 37.3 |
| $1,000,000 | $20,000 | 7.46 | 74.6 |
Step 5 — The result
With 7 GC contracts:
- Loss if stopped: 7 × $2,680 = $18,760 (1.88% of equity — under the cap, as designed)
- Gain at TP1 (60% scale-out): 4.2 contracts × 87.2 pts × $100 = $36,624
- Gain at TP2 (40% scale-out): 2.8 contracts × 101.9 pts × $100 = $28,532
- Total gross gain: $65,156 — or +6.5% on the $1M account
- Net R multiple: $65,156 ÷ $18,760 = 3.47R gross, 3.1R after slippage and commissions
This is what “3.1R” actually means in dollars. It is not a number on a chart — it is a specific, pre-computed outcome.
The three rules that made this trade survivable
- The stop was placed before the entry, at a level that invalidated the thesis — not at an arbitrary “pain threshold.”
- Position size was computed from the stop distance, not chosen by feel. The 2% rule is only meaningful if you actually do the division.
- We scaled out at two pre-defined targets. 60/40 split at TP1/TP2 locks in profit while leaving upside if the move extends. No trailing stop, no discretionary exits.
Lessons Learned
1. Confluence is not confirmation — but it is conviction
The Square of 9 90° angle at 4,100.5 and the Fib 0.500 retracement at 4,100.6 agreeing to within 0.1 points is rare. It does not guarantee a reversal — nothing does — but it tells you that if a reversal happens, it will happen here. That is enough to justify a trade with a 3:1 reward-to-risk profile.
2. Retrograde Venus is a metal-reversal signature, not a doom clock
A lot of retail astrology traders treat “Venus retrograde” as a blanket “don’t trade gold” rule. That is wrong. Venus retrograde in its own sign (Libra) is a reversal-of-trend signature for the metal — it says “expect the prevailing move to re-test and fail.” Gold had rallied from 4,036.8 to 4,097.2 in two sessions. The retrograde window said: that rally will be re-tested and rejected. It was.
3. The Moon–Mars opposition within 4 arcminutes was the volatility warning
We noted that Mars at 22°58’ Cancer and the Moon at 22°54’ Taurus were 4 arcminutes from an exact opposition. In practice, this manifested as a sharp, fast rejection — the October 28 session went from 4,097.2 to 4,051.6 (−1.1%) in hours. If you are going to trade a Moon–Mars opposition, size for a fast move and do not use wide stops. The volatility is the point.
4. Mercury retrograde forces the re-test — it does not prevent the move
Mercury retrograde at 25°01’ Libra (Vishakha, lord Jupiter) told us the market would re-test a prior level. It re-tested the October 22 breakdown zone at 4,097–4,101 and failed. The retrograde was not a reason to avoid the trade — it was a reason to expect the re-test and place a limit order there.
5. The 2% rule is not conservative — it is the only rule
The difference between a 3.1R trade and a blown account is position sizing. If we had sized this trade at 5% risk, the same 3.1R result would have produced a 15.5% gain — but a single stop-out would have cost 5% of the account, and three consecutive losses would have put us at −15%, requiring a 17.6% gain to recover. The 2% rule keeps you in the game long enough for the framework to work.
The Framework, In One Paragraph
Gann Square of 9 tells you where the market will turn. Sidereal transits tell you when. EMA crossovers and RSI divergence tell you whether the turn is real. You need all three. Two out of three is a coin flip with extra steps.
This trade worked because all three aligned on October 28, 2026: the 90° Square of 9 angle at 4,100.5, the Fib 0.500 at 4,100.6, the Venus/Mercury retrograde window, the Moon–Mars opposition, and the 4H EMA-20 rejection with RSI divergence. The entry was at 4,097.2, the stop at 4,124.0, the target at 4,010.0, and the result was 3.1R.
That is The Proof. Not a prediction — a process.
Want to See the Next One Live?
Every trade in The Proof series is documented with the exact planetary positions, the Gann Square of 9 levels, the Fibonacci grid, and the position-sizing math — because a trade you can’t reproduce is a trade you can’t trust.
The QuantEA Labs system runs this framework on gold, indices, and major FX pairs, with Swiss Ephemeris sidereal data feeding the timing layer and Gann geometry feeding the price layer. If you want to see the next setup before it resolves — not after — the system is where to look.
Read the next breakdown in The Proof series, or explore the full framework in our Gann Square of 9 and Vedic timing guides. The market gives you the geometry every day. The question is whether you have the framework to read it.
— Kim Ssa, QuantEA Labs