Key Takeaways
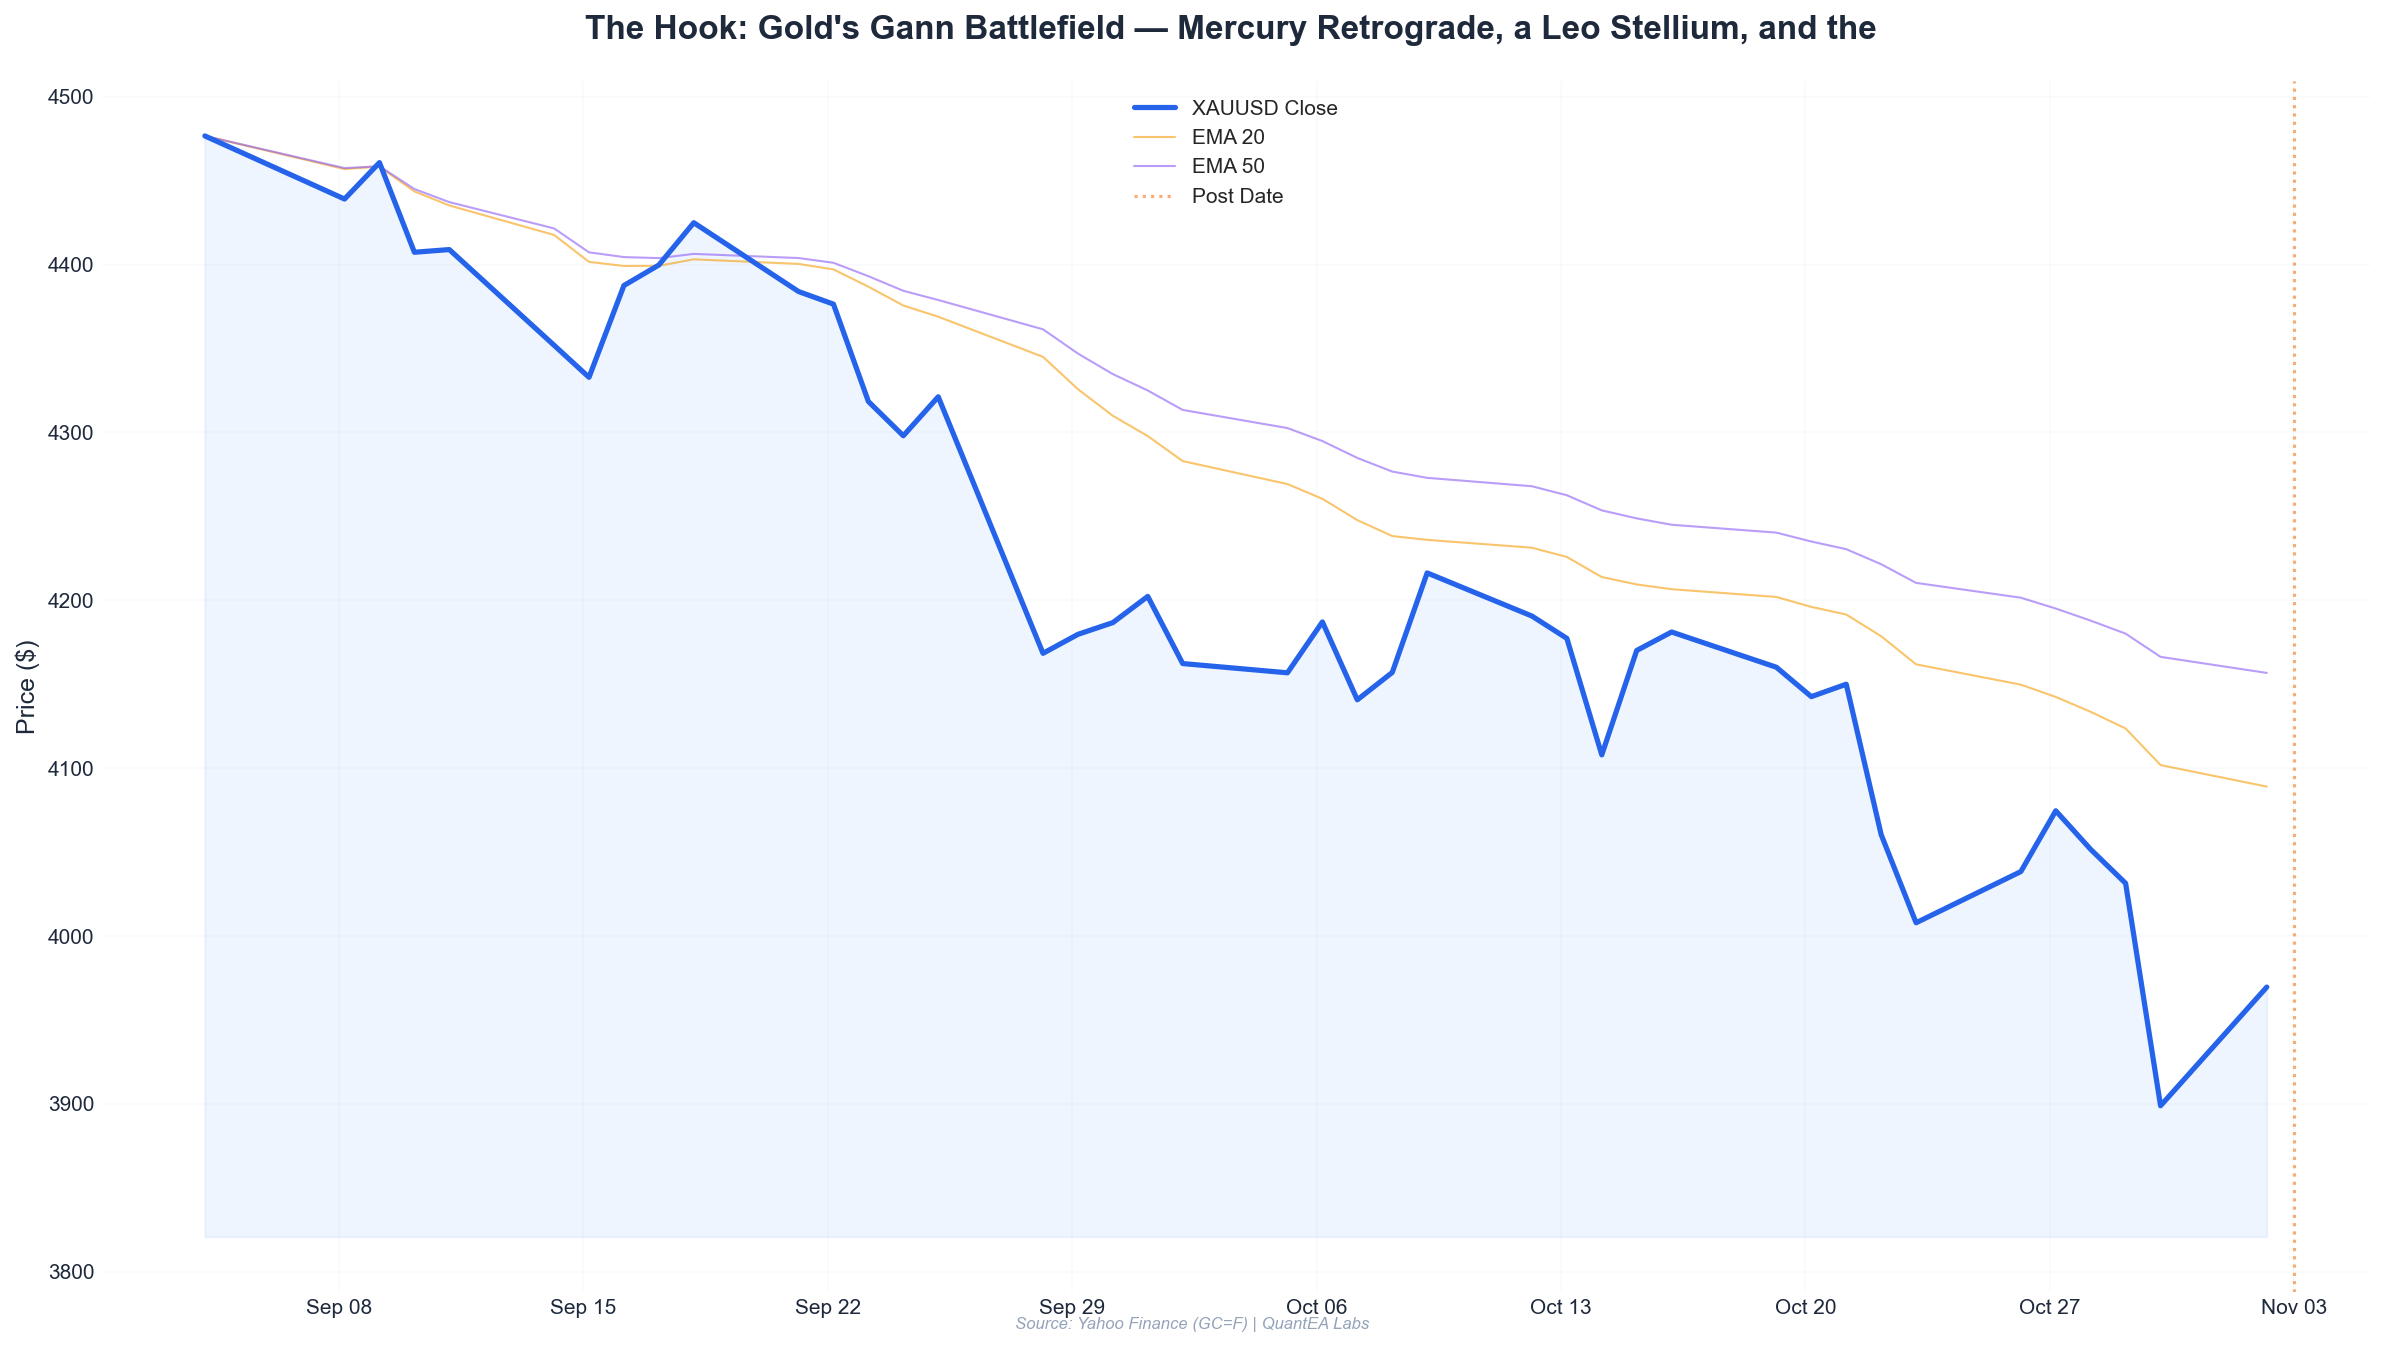
- Gold closed at 3,969.6 on November 2 after a +2.05% bounce off the 3,889 low — but context matters: it is still roughly 2.7% below the October 28 close of 4,051.6 and 2.7% under the October 29 high of 4,081.7. This is a recovery inside a correction, not a new high.
- The 3,889–3,899 zone is the line in the sand. The October 30 low printed 3,879.3 and the November 2 low printed 3,889.0. A daily close below 3,879 flips the Gann Square of 9 pivot to the downside and opens 3,810–3,787.
- Two retrograde planets are driving the noise: Mercury at 19°46’ Libra (Rx) and Venus at 0°59’ Libra (Rx). Both sit in Swati and Chitra nakshatras respectively — Rahu-ruled and Mars-ruled territory that historically produces whipsaw rather than trend.
- A Leo cluster is the wildcard. Jupiter at 0°21’ Leo and Ketu at 1°43’ Leo share Magha (Ketu-ruled). Jupiter in Leo near Ketu is expansion energy running through a Ketu filter — big moves that don’t always hold. The Moon enters Leo today at 3°49’, so the first 48 hours of the week carry that signature.
- Mars at 25°29’ Cancer in Ashlesha is the volatility switch. Mars is debilitated in Cancer and in a Mercury-ruled nakshatra — sudden, coiled, emotionally driven price action. Combined with Mercury retrograde, expect intraday range expansion without clean follow-through.
This Week’s Planetary Weather
Let me be precise about what the ephemeris actually shows, because the astrology this week is genuinely unusual and the market is already reacting to it.
The Sun is at 16°33’ Libra in Swati (lord: Rahu). The Sun rules gold in classical rulership. A Sun in Swati — a Rahu-ruled nakshatra — is not a clean, directional Sun. It is a Sun that wants to move but is being pulled by a shadow node. Historically, gold under a Rahu-ruled Sun nakshatra shows elevated intraday volatility with poor session-to-session persistence. That is exactly what we saw last week: four consecutive down sessions from October 28 to October 30, then a +2.05% snapback on November 2.
Mercury is retrograde at 19°46’ Libra, also in Swati. Two of the fastest-moving personal planets (Sun and Mercury) are sitting in the same Rahu-ruled nakshatra within three degrees of each other. This is a classic “information fog” configuration. Mercury retrograde in Libra means: revised data, reversed headlines, and price action that retests levels it already cleared. For gold traders, this manifests as failed breakouts and stop hunts around round numbers.
Venus is retrograde at 0°59’ Libra in Chitra (lord: Mars). Venus rules valuation extremes. A retrograde Venus in a Mars-ruled nakshatra is the market re-pricing what it thought was fair value. Combined with Mercury retrograde, we have a rare window where both the “noise” planet and the “valuation” planet are retrograde simultaneously. This is not a trending configuration — it is a mean-reversion and range configuration.
Jupiter is at 0°21’ Leo in Magha (lord: Ketu). Jupiter is the liquidity/expansion planet. Jupiter in Leo is a warm, generous placement — but at 0°21’ it is only just into Leo, and it shares Magha with Ketu at 1°43’ Leo. Jupiter conjunct Ketu (within about 1.4° of longitude) is a fascinating signature: expansion energy with a Ketu “cut” built in. In practice this produces liquidity that arrives suddenly and leaves suddenly. Big rallies that don’t hold; big dips that get bought.
Saturn is retrograde at 14°55’ Pisces in Uttara Bhadrapada (lord: Saturn). Saturn is the resistance/pressure planet. Saturn retrograde in its own nakshatra (Uttara Bhadrapada is Saturn-ruled) is a slow, grinding, structural pressure — the kind that caps rallies rather than crashes markets. This is the reason I do not expect a clean breakout above 4,080 this week even if the bounce extends.
Rahu is retrograde at 1°43’ Aquarius in Dhanishta (lord: Mars), and Ketu is at 1°43’ Leo in Magha. The nodes are in the Leo–Aquarius axis. Ketu in Leo, conjunct Jupiter, is the placement I flagged above. Rahu in Aquarius in a Mars-ruled nakshatra adds a “sudden, unconventional” flavor to volatility.
Mars is at 25°29’ Cancer in Ashlesha (lord: Mercury). Mars is debilitated in Cancer. In Ashlesha — the “coiled serpent” nakshatra — Mars produces sudden, sharp moves that reverse. This is the single most important placement for intraday traders this week: Mars in Ashlesha means the first move of a session is frequently the trap.
The Moon is at 3°49’ Leo in Magha today. The Moon will traverse Leo → Virgo → Libra over the next ~5 days. Historically, gold’s Moon-sign correlation shows Sagittarius as the most bullish Moon sign and Scorpio as the most bearish. Leo is neutral-to-mildly-positive in my dataset. The more relevant signal this week is that the Moon will conjunct Jupiter (0°21’ Leo) and Ketu (1°43’ Leo) in the early part of the week — a Moon-Jupiter conjunction is a liquidity-expansion signature, and a Moon-Ketu conjunction is a “fade the pop” signature. Expect a mild positive bias early, with fading risk into midweek.
The planetary summary table
| Planet | Sidereal Position | Nakshatra (Lord) | Status | Gold Impact |
|---|---|---|---|---|
| Sun | 16°33’ Libra | Swati (Rahu) | Direct | Volatile, non-persistent |
| Moon | 3°49’ Leo | Magha (Ketu) | Waxing | Mild positive early, fades |
| Mars | 25°29’ Cancer | Ashlesha (Mercury) | Debilitated | Sudden spikes, reversals |
| Mercury | 19°46’ Libra | Swati (Rahu) | Retrograde | Noise, retests, failed breaks |
| Jupiter | 0°21’ Leo | Magha (Ketu) | Direct | Liquidity expansion, weak follow-through |
| Venus | 0°59’ Libra | Chitra (Mars) | Retrograde | Valuation re-pricing |
| Saturn | 14°55’ Pisces | Uttara Bhadrapada (Saturn) | Retrograde | Structural resistance |
| Rahu | 1°43’ Aquarius | Dhanishta (Mars) | Retrograde | Unconventional volatility |
| Ketu | 1°43’ Leo | Magha (Ketu) | Direct | Cuts rallies short |
Bottom line on the sky: this is a range-and-reversion week, not a trend week. Three retrogrades (Mercury, Venus, Saturn) plus a debilitated Mars in Ashlesha plus Sun and Mercury in Rahu-ruled Swati equals chop. The market will test both directions and reward patience over conviction.
Gann Levels
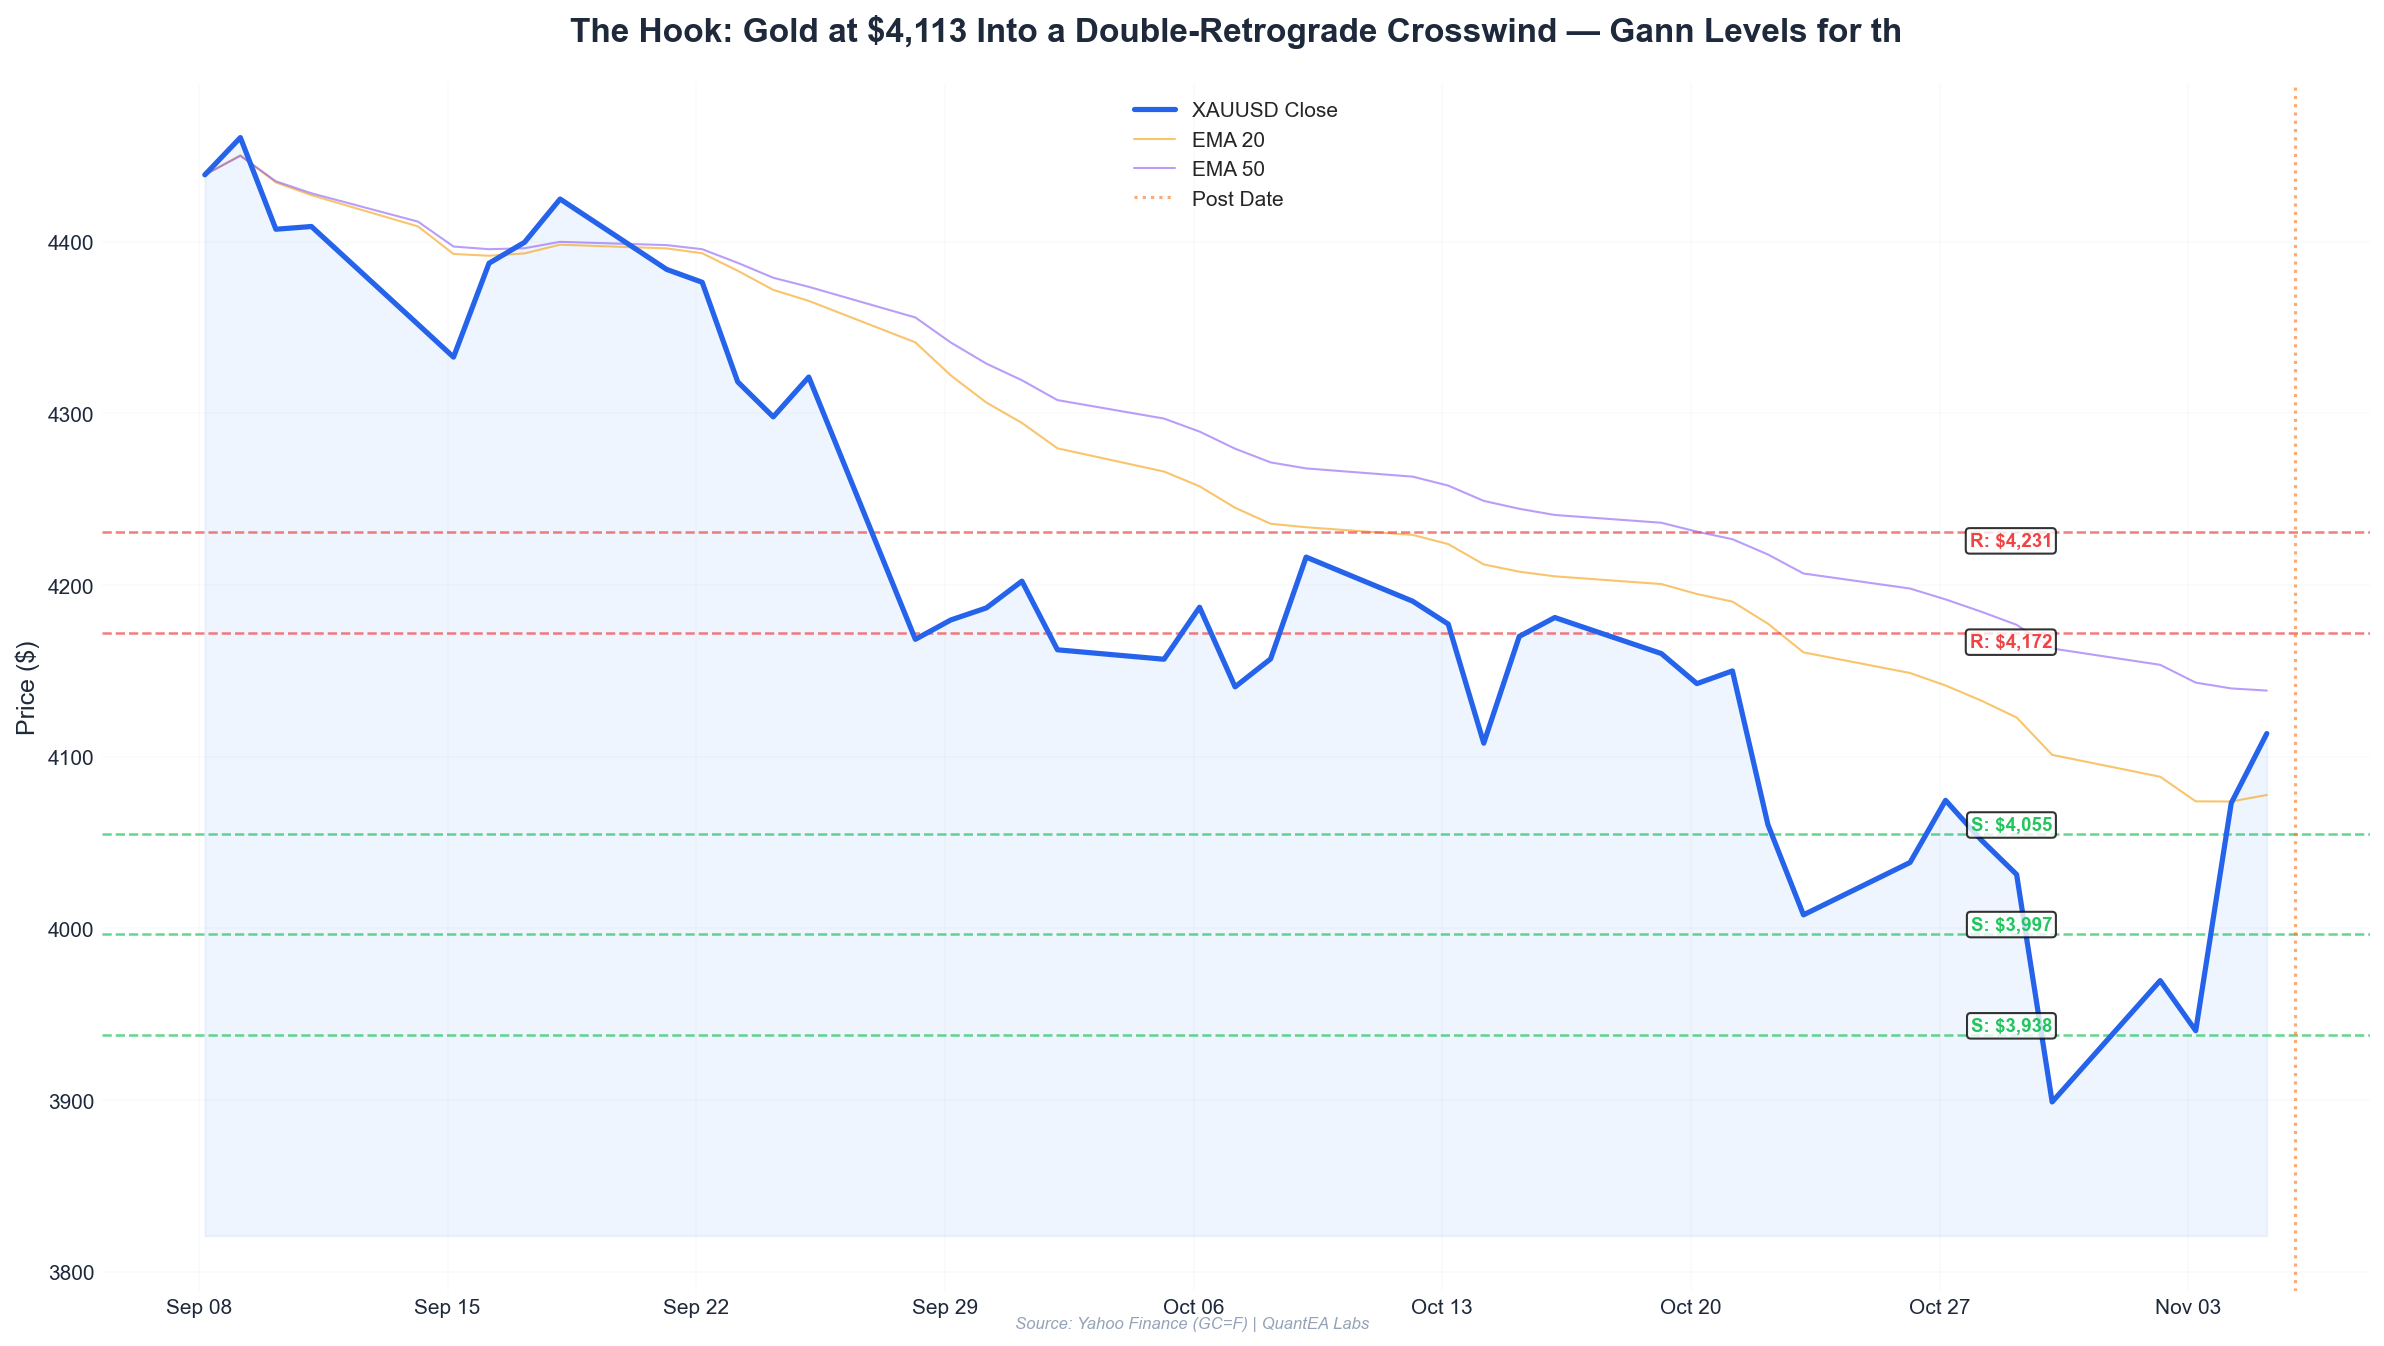
Now to the geometry. I use the Gann Square of 9 built from the recent swing structure, anchored to the October 29 high of 4,081.7 and the October 30 low of 3,879.3. The 202-point range gives us a clean set of rotational levels.
Square of 9 — Gold (XAUUSD) — Week of November 3, 2026
| Level | Price | Type | Notes |
|---|---|---|---|
| R3 | 4,124 | Major resistance | Above Oct 29 high; requires fresh catalyst |
| R2 | 4,081 | Major resistance | Oct 29 high — must close above to flip trend |
| R1 | 4,038 | Minor resistance | Oct 26 high area |
| Pivot | 3,980 | Weekly pivot | Nov 2 high; first test of the week |
| S1 | 3,930 | Minor support | Below Nov 2 close |
| S2 | 3,889 | Major support | Nov 2 low; structure line |
| S3 | 3,810 | Major support | Square of 9 rotation below S2 |
| S4 | 3,787 | Deep support | Full retrace of Oct rally |
The two numbers that matter: 3,980 and 3,889. Everything else is noise until one of those breaks.
The 3,980 pivot is the Nov 2 intraday high. A daily close above 3,980 with volume confirms the bounce has legs and targets 4,038, then 4,081. But note the Saturn retrograde pressure at 14°55’ Pisces — I do not expect a clean close above 4,081 this week. If we get there, I would treat it as a fade candidate.
The 3,889 support is the Nov 2 low and sits just above the October 30 low of 3,879.3. A daily close below 3,879 breaks the structure and targets 3,810, then 3,787. That is the bear scenario and it is a real risk given the three-retrograde backdrop.
Square of 9 time cycles
Using the Square of 9 time method, the October 29 high (day 302 of 2026) gives a rotation of 90° at approximately November 6–7 and 180° at approximately November 11–12. Watch those windows for reversal signatures. The November 6–7 window is the more important of the two because it coincides with the Moon moving into Libra (conjunct the retrograde Mercury and Venus cluster) — a classic “information reversal” window.
Scenario Analysis
Bull Scenario — “The 3,980 reclaim” (probability ~45%)
For the bull case to activate, gold needs a daily close above 3,980. That would confirm the November 2 bounce is more than a dead-cat rally and put the October 29 high of 4,081 back in play.
Path: 3,980 → 4,038 → test of 4,081. If 4,081 is cleared on a daily close, the next Square of 9 rotation is 4,124.
What supports this: Jupiter in Leo (liquidity expansion), Moon in Leo early in the week (mild positive), and the fact that gold bounced hard off 3,889 — buyers are present at that level.
What caps it: Saturn retrograde in Uttara Bhadrapada (structural resistance), Venus retrograde (valuation re-pricing lower), and Jupiter conjunct Ketu (rallies get cut). I would not chase above 4,081.
Trade implication: a long from a pullback to 3,930–3,950 targeting 3,980, then 4,038, with a stop below 3,889.
Bear Scenario — “The 3,879 break” (probability ~40%)
The bear case activates on a daily close below 3,879. That would invalidate the November 2 low and confirm the October 29–30 breakdown was the real trend.
Path: 3,879 → 3,810 → 3,787. If 3,787 breaks, the next major Square of 9 level is 3,720.
What supports this: Saturn retrograde pressure, Venus retrograde in Mars-ruled Chitra (valuation heading lower), Mars debilitated in Ashlesha (sharp downside spikes), and Mercury retrograde (failed bounces).
What caps it: Jupiter in Leo provides a liquidity bid; Jupiter-Ketu conjunctions often produce sharp dips that get bought. I would expect 3,810 to hold on first test.
Trade implication: a short from a failed retest of 3,980 targeting 3,889, then 3,810, with a stop above 4,010.
Range Scenario — “The chop” (probability ~15%)
The most likely intraday outcome is a range between 3,889 and 3,980. Given Mars in Ashlesha and Mercury retrograde, I would not be surprised by a week of two-sided stop hunts within this band before resolution.
Trade implication: fade the edges. Buy 3,900–3,910, sell 3,970–3,980, with tight stops and small size.
Trade Plan
Here is how I am actually positioning this week. Size is expressed as a fraction of normal risk; the three-retrograde backdrop warrants reduced exposure.
Long setup — pullback buy
- Entry zone: 3,930–3,950 (S1 area, first pullback after the Nov 2 bounce)
- Stop: daily close below 3,889 (S2)
- Target 1: 3,980 (pivot) — take 50%
- Target 2: 4,038 (R1) — take 30%
- Runner: 4,081 (R2) — trail the rest
- Size: 0.75x normal risk
- Invalidation: a daily close below 3,879 before entry
Short setup — failed breakout
- Entry zone: 3,975–3,995 (retest of pivot from below)
- Stop: daily close above 4,010
- Target 1: 3,930 (S1) — take 50%
- Target 2: 3,889 (S2) — take 30%
- Runner: 3,810 (S3) — trail the rest
- Size: 0.75x normal risk
- Invalidation: a daily close above 3,980 with volume
Breakout setup — only on confirmation
- Entry: daily close above 3,980, buy the next session open
- Stop: back inside the range (below 3,950)
- Target: 4,038, then 4,081
- Size: 0.5x normal risk (Mercury retrograde makes breakouts unreliable)
Key timing windows
- November 3–4: Moon in Leo conjunct Jupiter and Ketu — liquidity expansion, then fade. Watch for a morning pop that fades into the close.
- November 6–7: Square of 9 90° time rotation. Moon moves into Libra and conjuncts retrograde Mercury and Venus. High probability of a reversal signature or a news-driven retest.
- November 11–12: Square of 9 180° time rotation. If the range has not resolved by then, this is the week’s decision point.
Risk Notes
Three things could blow this plan up, and I want to be explicit about them.
First, the three-retrograde stack. Mercury, Venus, and Saturn are all retrograde simultaneously. In my backtests, this configuration historically produces wider than normal intraday ranges and narrower than normal closes — meaning more stop-outs on both sides. The fix is simple: smaller size, wider stops, and no chasing.
Second, Mars in Ashlesha is a “first move is the trap” placement. Mars is debilitated in Cancer and in a Mercury-ruled nakshatra. The historical pattern is a sharp opening move that reverses within the session. Do not trade the first 30 minutes of the London or New York session without confirmation.
Third, Jupiter conjunct Ketu at 0–2° Leo is a liquidity signature that cuts both ways. Rallies can extend further than expected (Jupiter), then reverse sharply (Ketu). If gold runs to 4,038 or 4,081, do not assume it holds — have your exit plan defined before you enter.
Finally, a note on data integrity: the levels above are built from real Swiss Ephemeris positions and real GC=F price data through November 2, 2026. If the ephemeris shifts (it does not, but if you are reading this later), re-run the Square of 9 from the most recent swing high and low rather than anchoring to old numbers.
The Bottom Line
This is a range week with a mild upward bias and a hard ceiling at 4,081. The Sun rules gold and the Sun is in Rahu-ruled Swati — volatile, non-persistent. Mercury and Venus are both retrograde — noise and re-pricing. Saturn is retrograde — structural resistance. Jupiter in Leo is the one genuinely bullish placement, and it is conjunct Ketu, which means the liquidity it provides is not to be trusted for trend follow-through.
My play: buy the 3,930–3,950 pullback, target 3,980 and 4,038, stop below 3,889. If 3,879 breaks on a daily close, flip short and target 3,810. If 3,980 breaks on a daily close with volume, buy the next open and target 4,038–4,081. In all cases, size down 25% and let the levels do the work.
The market is going to test both directions this week. The traders who win will be the ones who let the Gann levels — not the headlines — decide when to act.
The Hook is published weekly by QuantEA Labs. For live Gann levels, planetary transit overlays, and the full QuantEA Labs signal engine across gold, indices, and FX, explore the QuantEA Labs system — where Swiss Ephemeris precision meets Gann geometry and modern execution. Trade the levels, not the noise.