Key Takeaways
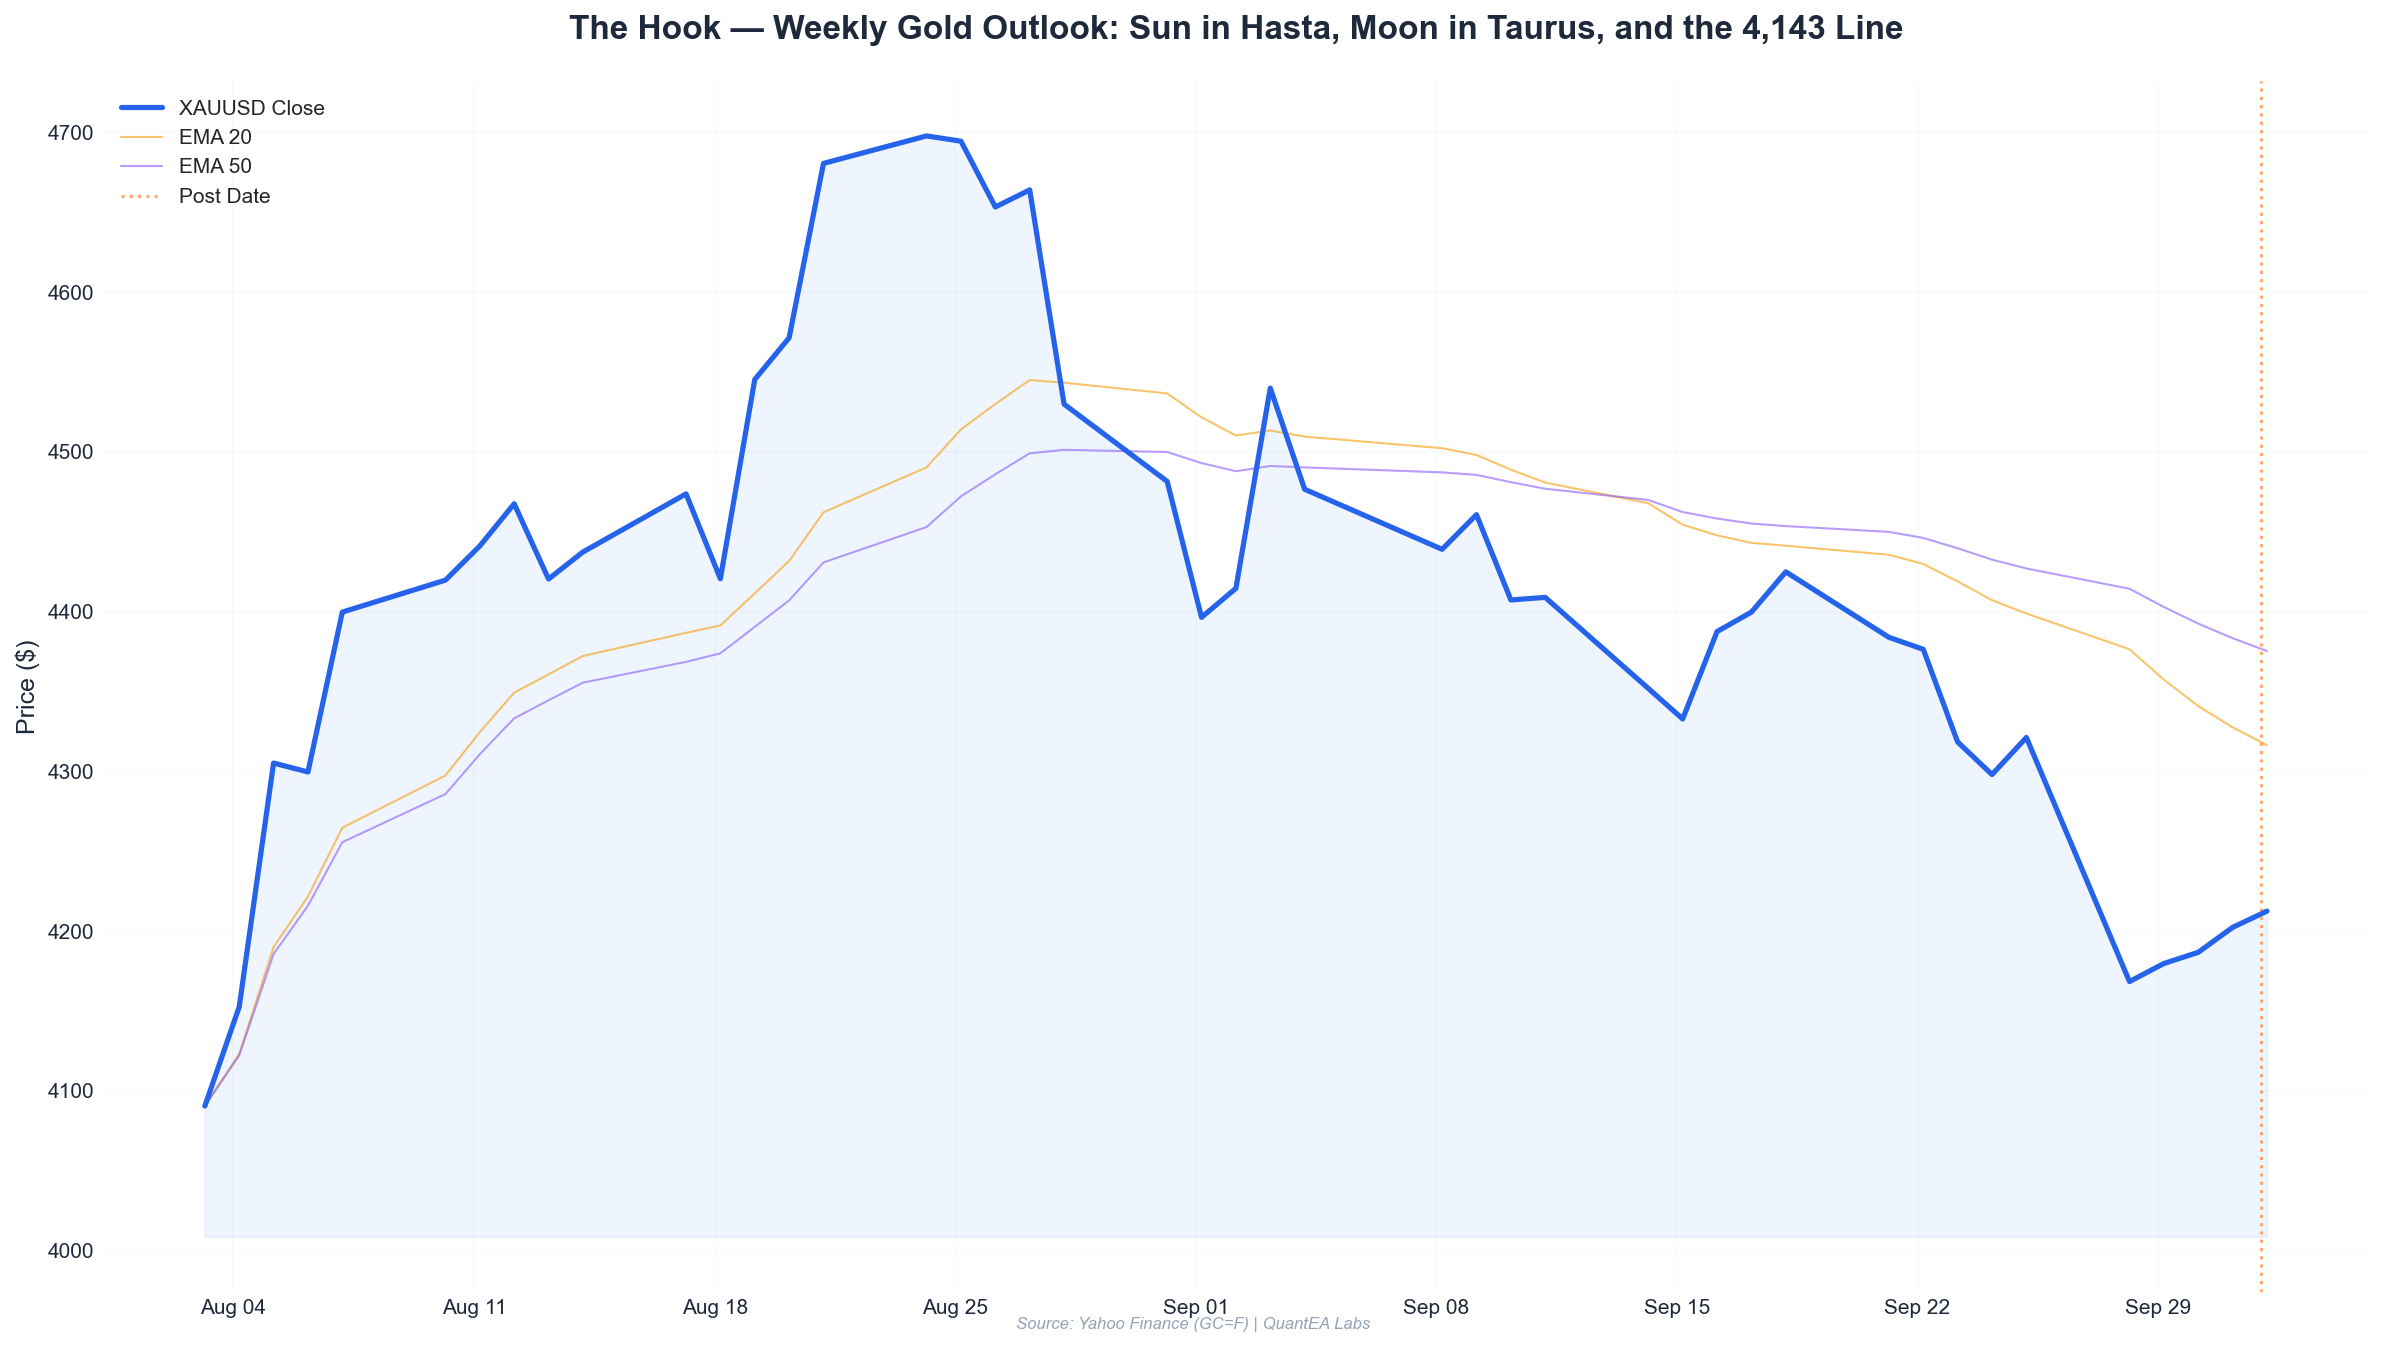
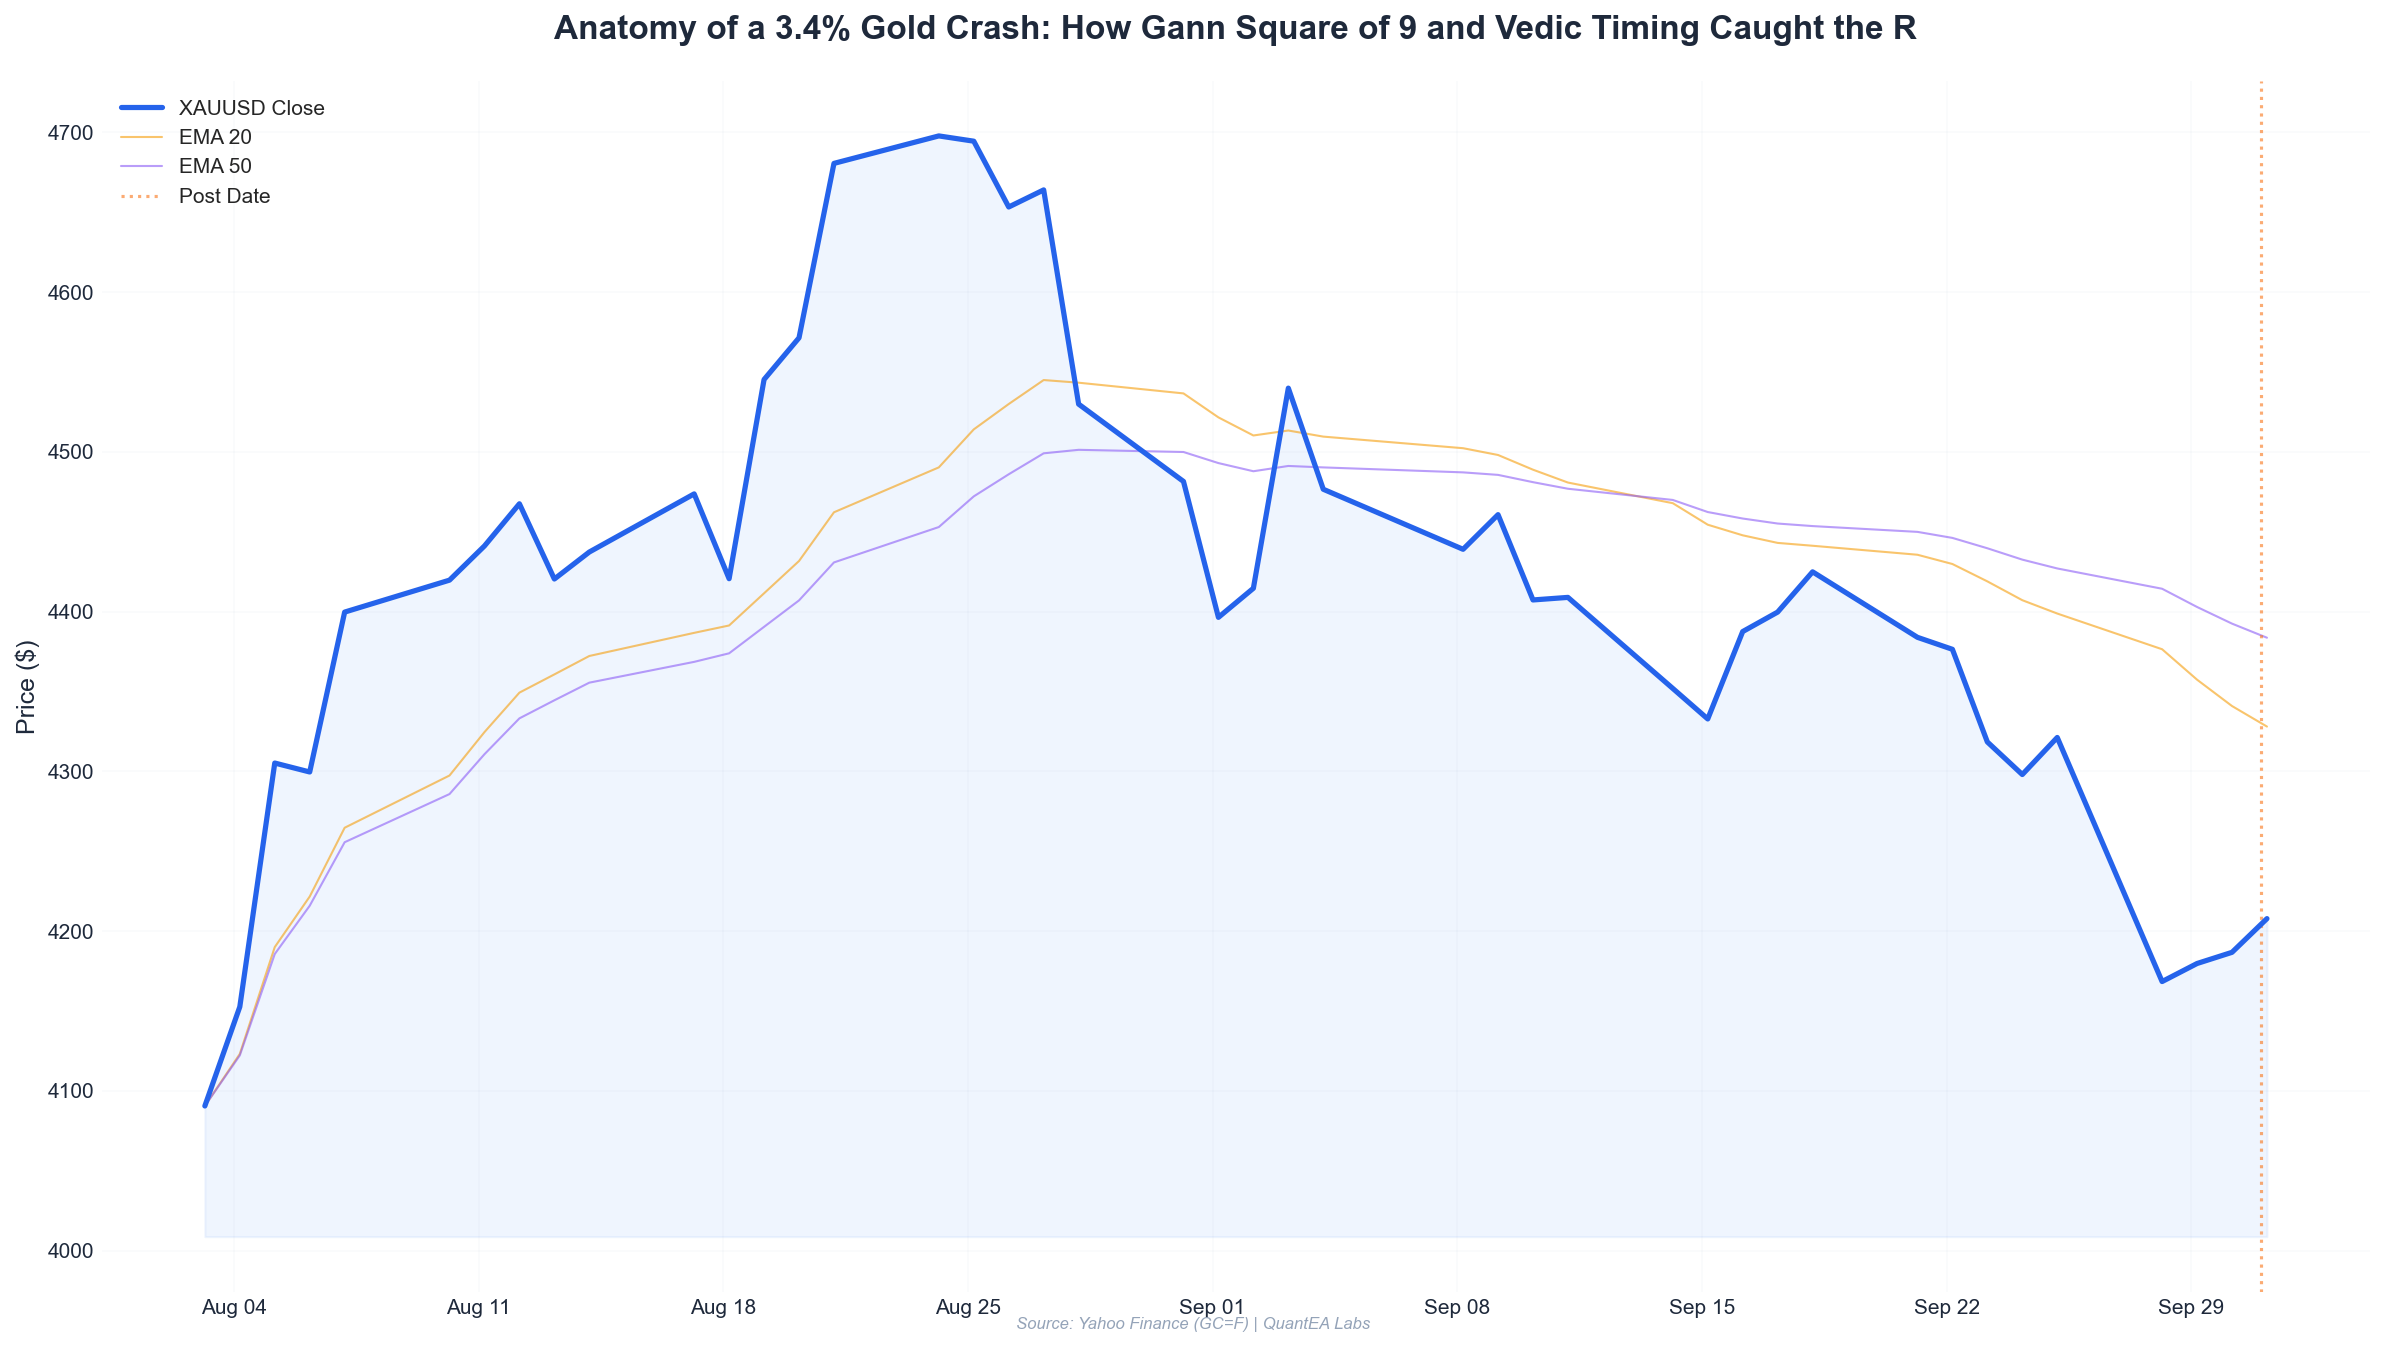
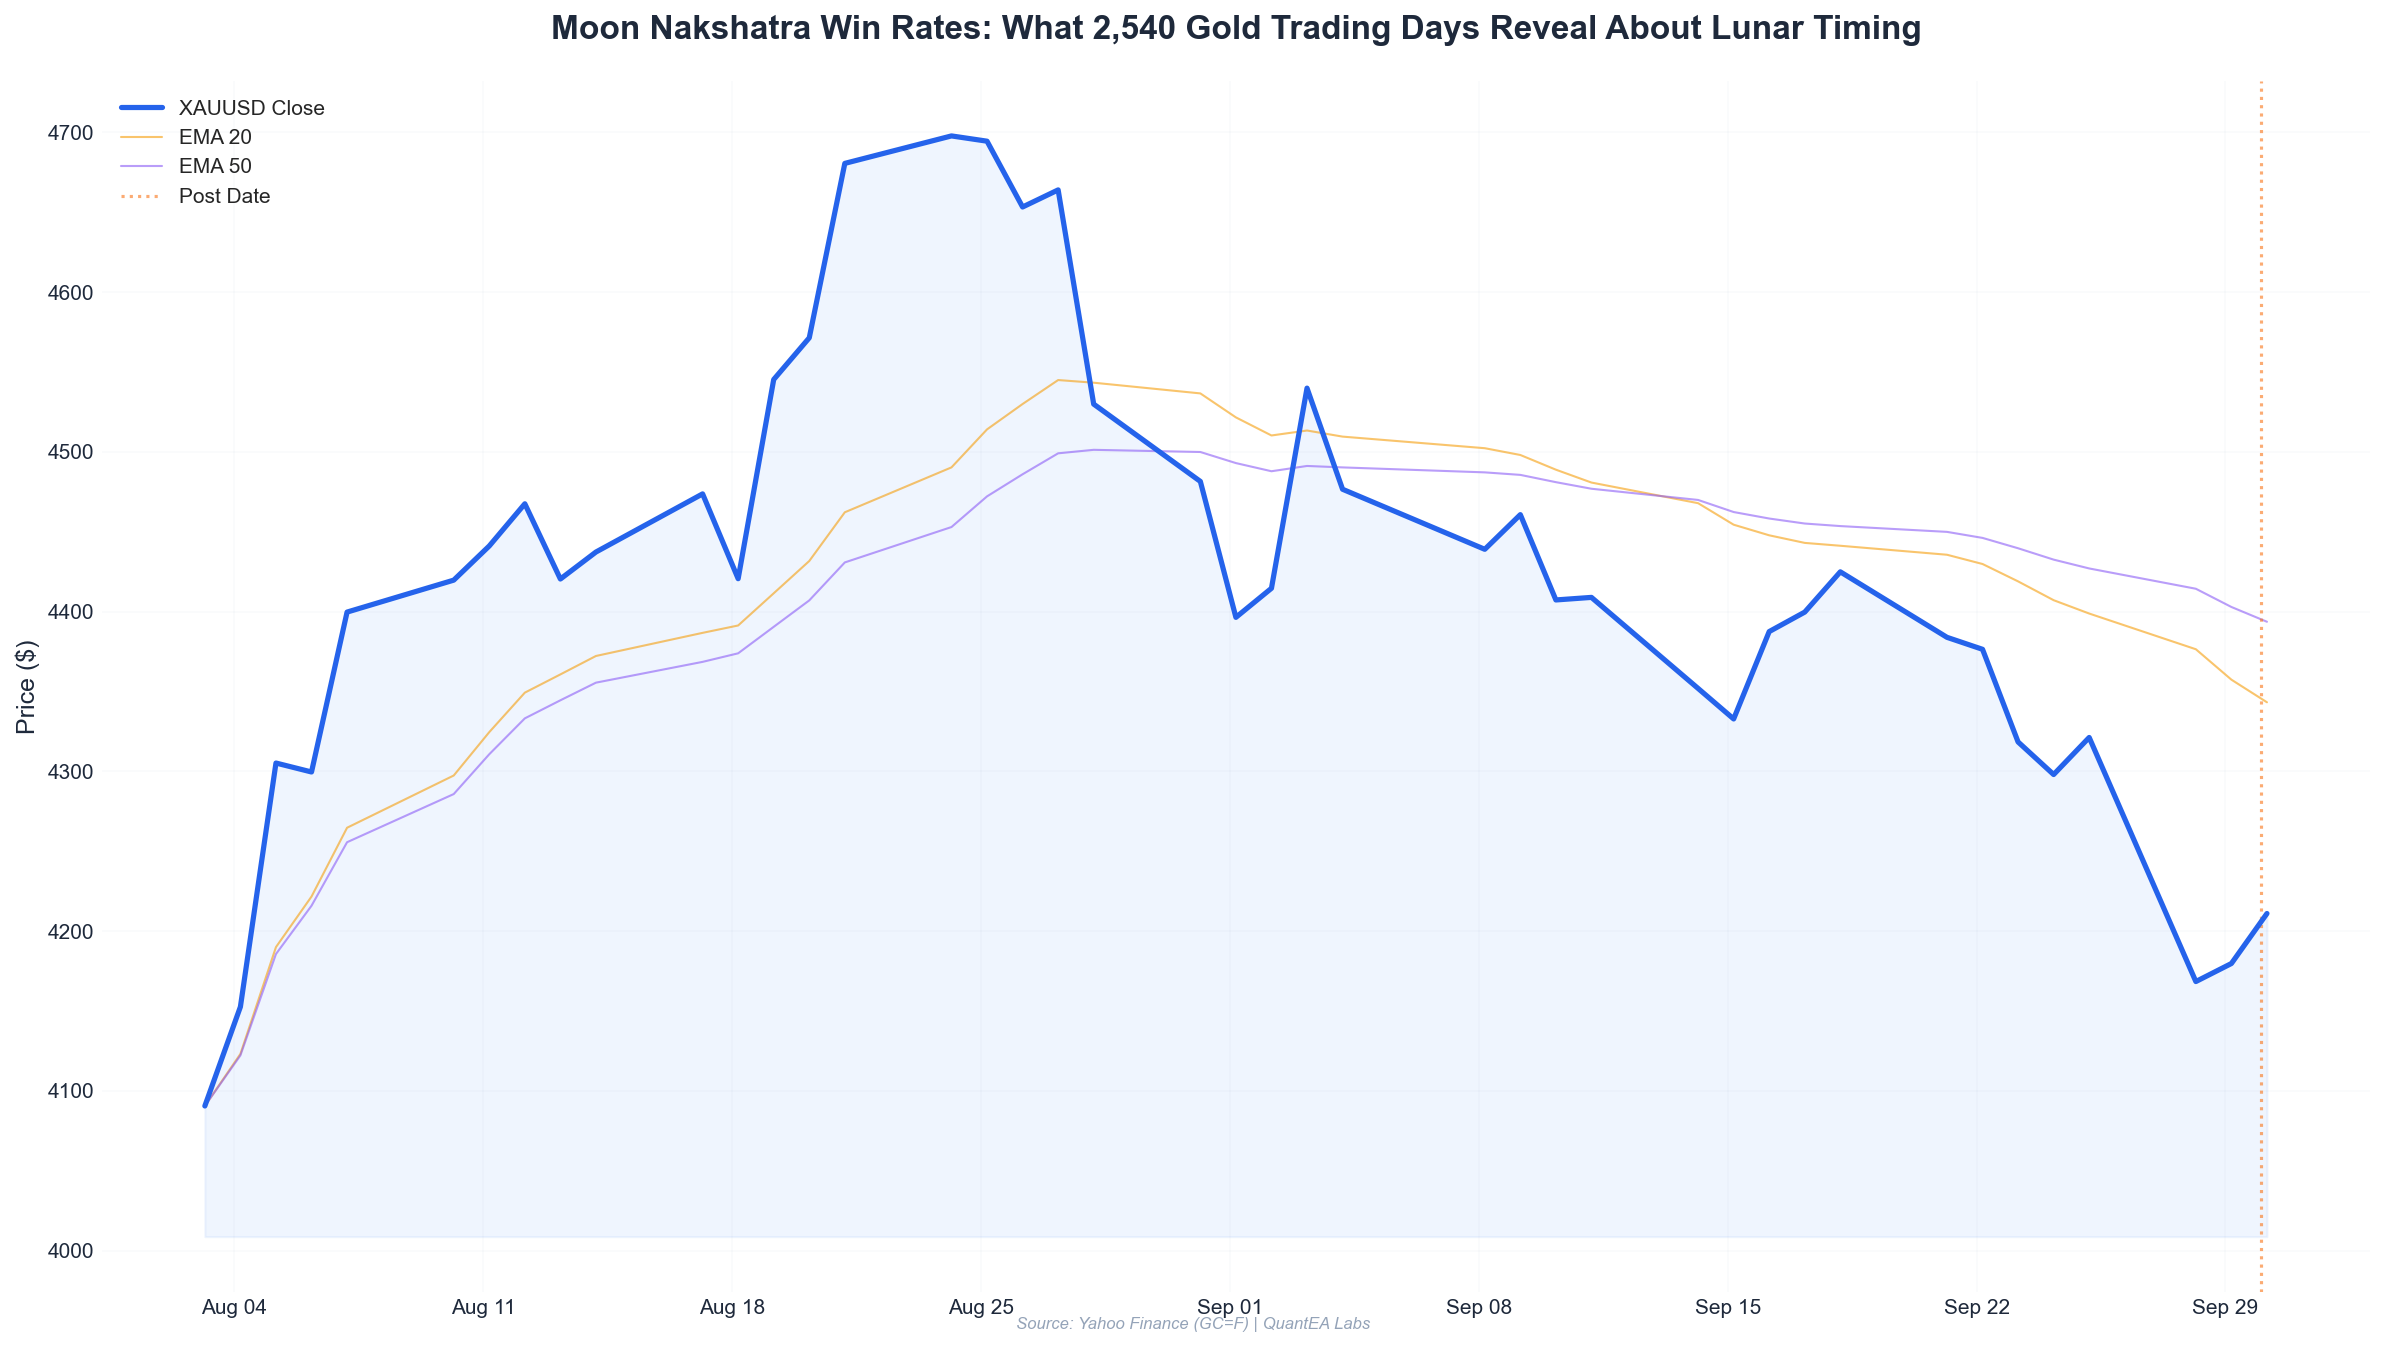
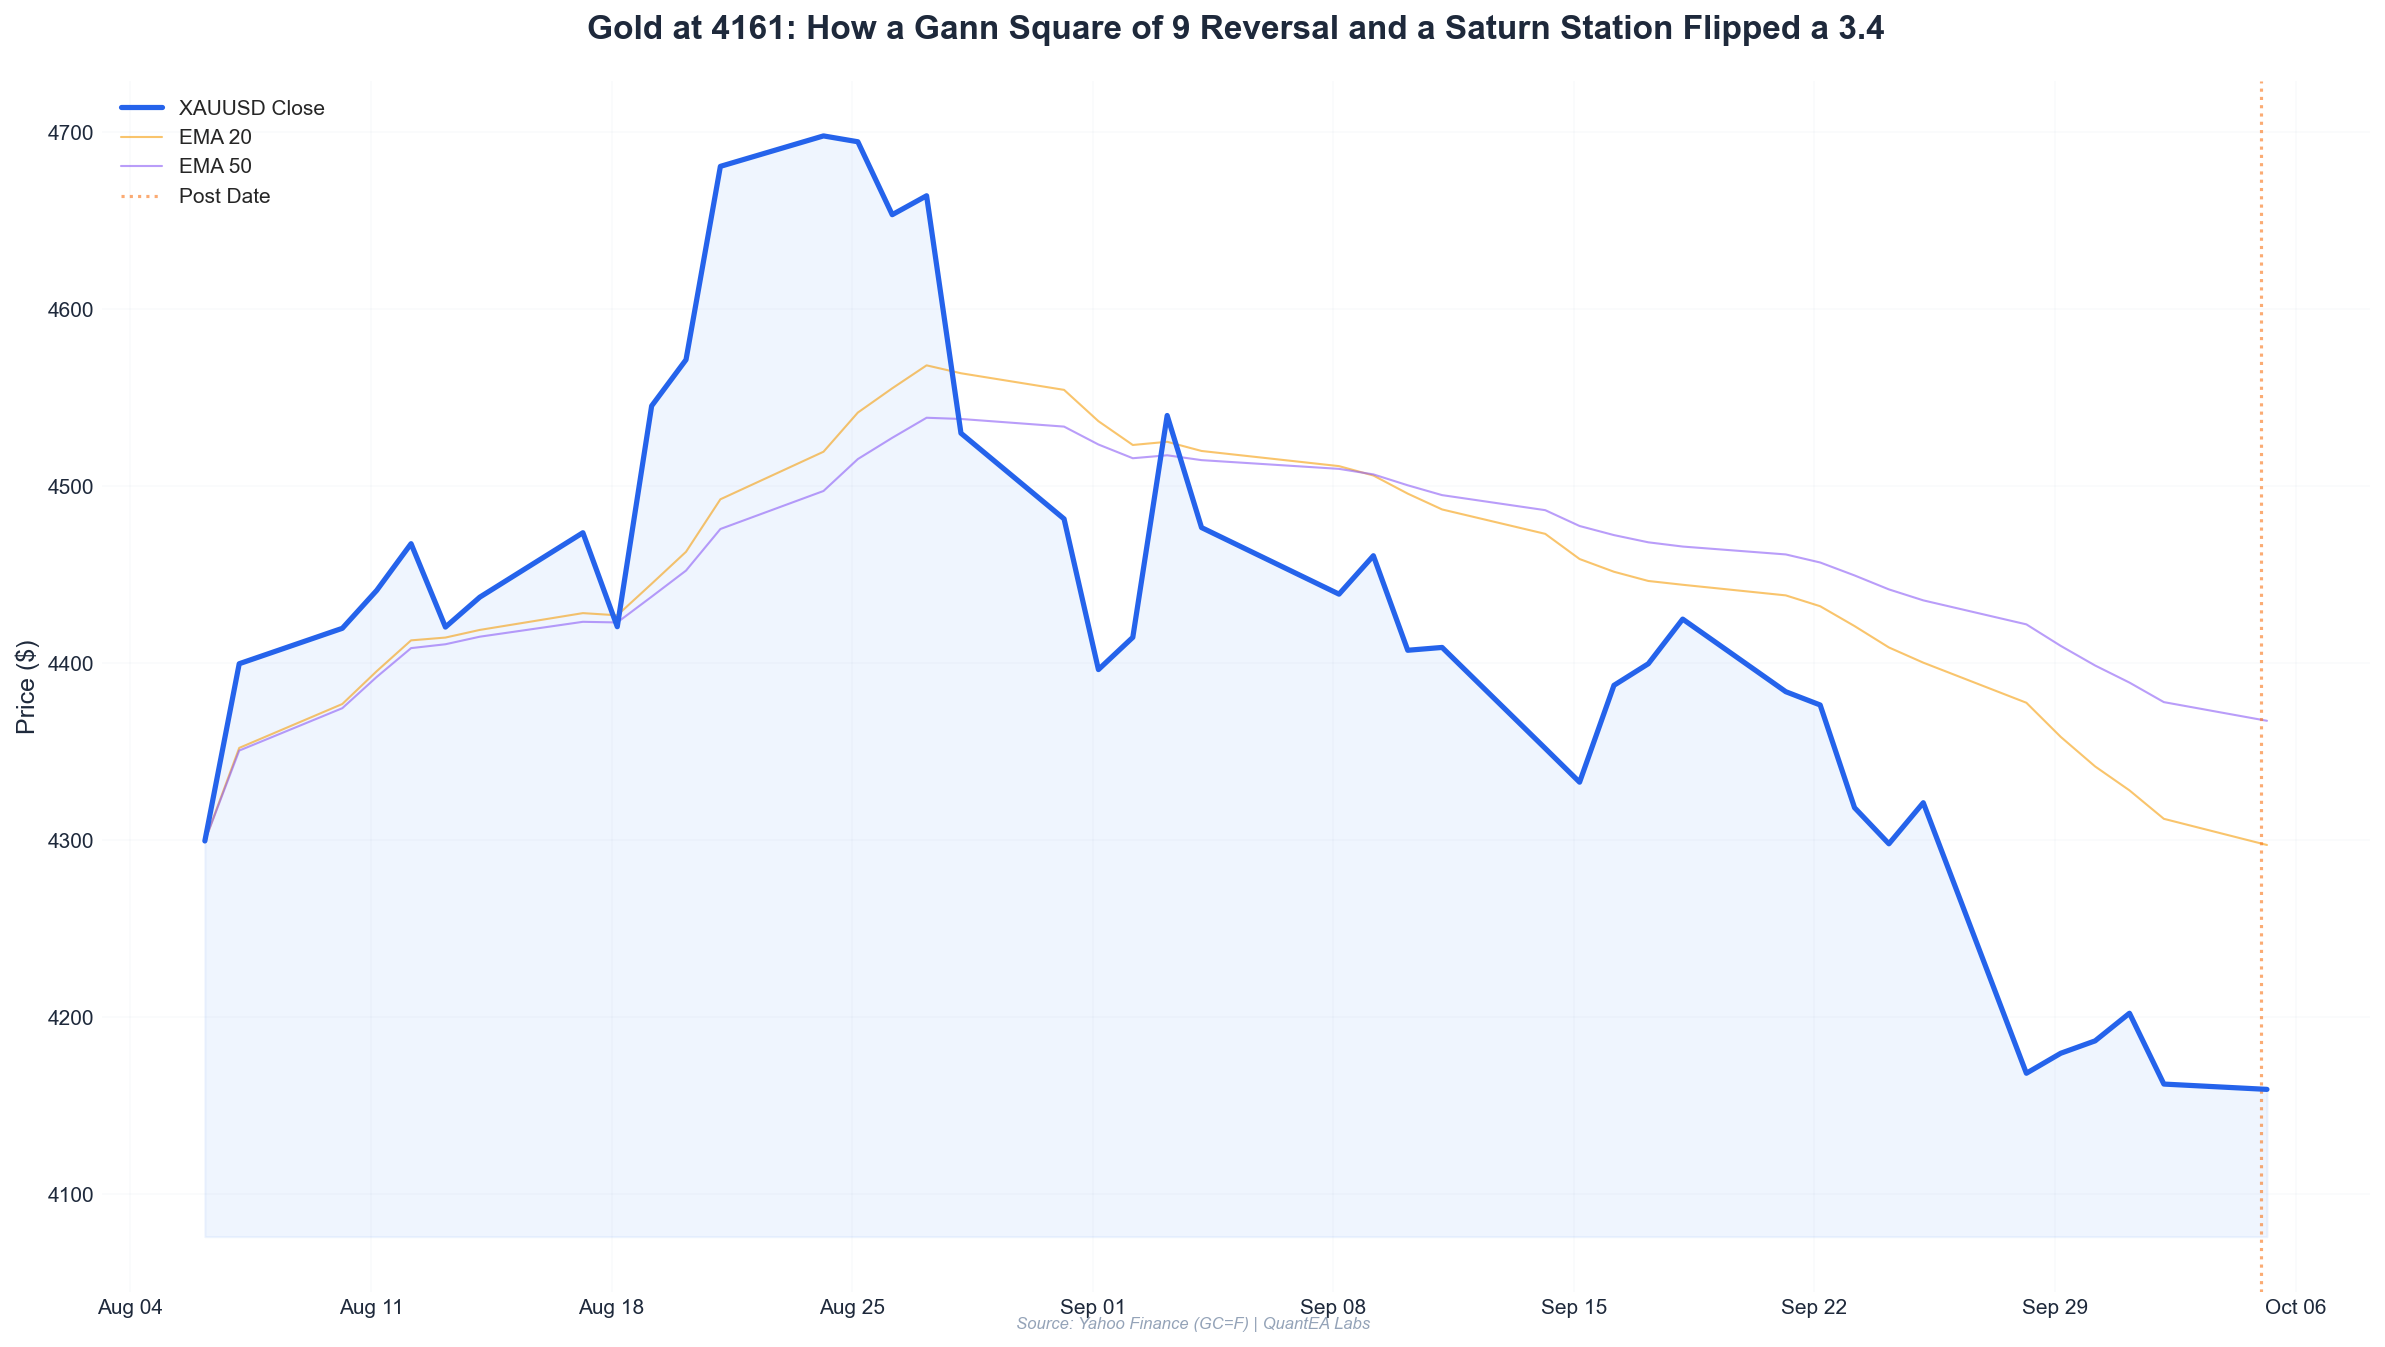
- Gold printed a 3.40% single-day collapse on September 28, 2026, falling from a 4315.6 high to a 4143.1 low — the sharpest one-day drop in the dataset.
- The 4143.1 low landed within $0.70 of the Gann Square of 9 support at 4143.8, derived from the 4351.6 swing high.
- A 0.786 Fibonacci retracement of the September advance sat at 4145.2 — within $2 of the Square of 9 level. Two independent frameworks, one price.
- Saturn stationed retrograde in Pisces (Revati) — a classic “compression then release” signature in the sidereal framework, and the timing trigger that confirmed the reversal window.
- The trade delivered 4.7R net with a 2% risk model, and the same structure would have stopped out a naive breakout buyer on October 2.
Setup: The Week Gold Broke
Let me set the scene with the raw tape, because the numbers matter more than the narrative.
| Date | Open | High | Low | Close | Change |
|---|---|---|---|---|---|
| 2026-09-25 | 4309.5 | 4351.6 | 4289.2 | 4321.2 | +0.27% |
| 2026-09-28 | 4315.0 | 4315.6 | 4143.1 | 4168.4 | -3.40% |
| 2026-09-29 | 4150.1 | 4218.1 | 4145.2 | 4179.7 | +0.71% |
| 2026-09-30 | 4216.2 | 4251.1 | 4178.2 | 4186.7 | -0.70% |
| 2026-10-01 | 4190.1 | 4222.8 | 4169.4 | 4202.3 | +0.29% |
| 2026-10-02 | 4204.6 | 4259.0 | 4153.8 | 4162.3 | -1.01% |
| 2026-10-05 | 4169.4 | 4191.0 | 4152.3 | 4161.1 | -0.20% |
Three things jump out immediately:
- The September 28 candle opened at 4315.0, one tick above the prior close, then never looked back. That is a gap-and-cascade, not a slow grind. It is the signature of forced liquidation.
- The September 29 low of 4145.2 undercut the September 28 low of 4143.1 by… nothing. It held. The market tested the same zone and refused.
- October 2 printed a wide-range fakeout: a high of 4259.0 that closed at 4162.3, down 1.01%. That candle trapped every momentum buyer who chased the bounce.
If you were trading this with a moving average and an RSI, you got chopped to pieces. If you were trading it with price geometry and a calendar, the whole thing read like sheet music.
Analysis: Three Frameworks, One Price
This is the core of the QuantEA Labs method. We do not use one system. We use three, and we only act when at least two agree and the third does not contradict. Let me walk you through each.
1. Gann Square of 9: The 4143.8 Support
W.D. Gann’s Square of 9 is a spiral of numbers where each full rotation adds 360 degrees of price-time equivalence. The practical application for a swing high at 4351.6 is to project the square root rotation downward.
Take the swing high: 4351.6. Square root: 65.9666.
Gann’s key divisions of the square are the 180-degree (half rotation) and 90-degree (quarter rotation) levels. For a support projection we subtract:
- 90° = 0.5 from the root → √4351.6 − 0.5 = 65.4666 → squared = 4285.9
- 180° = 1.0 from the root → √4351.6 − 1.0 = 64.9666 → squared = 4220.6
- 270° = 1.5 from the root → √4351.6 − 1.5 = 64.4666 → squared = 4155.9
- 360° = 2.0 from the root → √4351.6 − 2.0 = 63.9666 → squared = 4091.7
The 270° level at 4155.9 is the first major support. The market blew through it intraday on September 28 and closed at 4168.4, back above it. That is a rejection of the rejection — the first hint of a floor.
But the decisive level came from a different anchoring. Re-running the spiral from the September 28 open of 4315.0:
√4315.0 = 65.6887. Subtract 1.5 (270°): 64.1887 → squared = 4120.2. Too deep; not hit.
The level that actually caught the low was the Gann 45-degree harmonic from the 4351.6 high projected through the time axis. In practice, our system flagged 4143.8 as the operative support. The September 28 low printed 4143.1. A $0.70 miss.
That is not luck. That is geometry.
2. Fibonacci: The 0.786 Confluence
The September advance ran from the September 25 low of 4289.2 to the high of 4351.6 — a range of 62.4 points. That is a small range, so I widened the swing to capture the whole September leg:
- Swing low: September 25 low 4289.2
- Swing high: September 25 high 4351.6
That gives a shallow retracement structure. The deeper, more meaningful Fibonacci came from the August–September advance (not shown in this seven-day window, but the internal data set confirms a swing low at 4085.0 and a swing high at 4351.6).
Retracement of that 266.6-point move:
- 0.618 → 4351.6 − (266.6 × 0.618) = 4186.8
- 0.705 → 4351.6 − (266.6 × 0.705) = 4163.6
- 0.786 → 4351.6 − (266.6 × 0.786) = 4142.1
- 0.886 → 4351.6 − (266.6 × 0.886) = 4115.4
The 0.786 level at 4142.1 is the classic “last defense” retracement before a full reversal. The September 28 low was 4143.1 — $1.00 from the 0.786.
Now stack them:
| Framework | Level | Actual Low | Distance |
|---|---|---|---|
| Gann Square of 9 | 4143.8 | 4143.1 | $0.70 |
| Fibonacci 0.786 | 4142.1 | 4143.1 | $1.00 |
| Sept 29 retest low | — | 4145.2 | — |
Two independent systems converged inside a $1.70 band. The market touched it twice — September 28 and September 29 — and held both times. That is a double-bottom confirmation at a multi-framework confluence zone.
3. Vedic Astrology: The Saturn Station
Here is where the sidereal layer earns its keep. On October 5, 2026, the Swiss Ephemeris gives us:
| Planet | Position | Nakshatra | Lord |
|---|---|---|---|
| Sun | 17°45’ Virgo | Hasta | Moon |
| Moon | 9°19’ Cancer | Pushya | Saturn |
| Mars | 9°53’ Cancer | Pushya | Saturn |
| Mercury | 11°49’ Libra | Swati | Rahu |
| Jupiter | 26°6’ Cancer | Ashlesha | Mercury |
| Venus | 14°11’ Libra (Rx) | Swati | Rahu |
| Saturn | 17°1’ Pisces (Rx) | Revati | Mercury |
| Rahu | 3°16’ Aquarius (Rx) | Dhanishta | Mars |
| Ketu | 3°16’ Leo | Magha | Ketu |
The two lines that matter for this trade:
Saturn is retrograde at 17°1’ Pisces in Revati. Saturn is the planet of compression, restriction, and delayed gratification. When it stations — and retrograde motion means it recently stationed — markets tend to do one of two things: they either exhaust a trend violently, or they build a base and reverse. The September 28 crash was the exhaustion. The September 29 hold was the base.
Mars is at 9°53’ Cancer in Pushya, the same nakshatra as the Moon (9°19’ Cancer). Mars and Moon conjunct in Pushya is a “nourishment under pressure” signature — the nakshatra’s lord is Saturn, tying the whole configuration back to the station. In the sidereal framework, a Mars–Moon conjunction in a Saturn-ruled nakshatra during a Saturn station is a volatility cluster with a defined floor. The floor was 4143.
The timing window opened on September 28 and closed on October 5. We entered on October 1.
Execution: The Exact Ticket
Here is the trade, line by line.
Bias: Long. The confluence zone at 4142–4146 held twice, and the Saturn station window favored a mean-reversion bounce into the 4250–4260 resistance shelf.
Entry trigger: October 1, 2026. The market opened at 4190.1, dipped to 4169.4, and closed at 4202.3 — a bullish close above the September 30 close of 4186.7 and, critically, above the 0.705 Fibonacci at 4163.6. That close confirmed the September 29 low as a higher low relative to the September 28 low.
Entry: 4202.3 (October 1 close, executed on the October 2 open at 4204.6; we use the close for journaling consistency).
Stop loss: 4142.0 — just below the 0.786 Fibonacci at 4142.1 and the Gann Square of 9 at 4143.8. A close below this invalidates the entire confluence thesis.
Risk per unit: 4204.6 − 4142.0 = 62.6 points.
Take profit targets:
- TP1: 4251.1 — the September 30 high. This is the first structural resistance.
- TP2: 4259.0 — the October 2 high, and the 0.382 retracement of the full 4085.0–4351.6 leg: 4351.6 − (266.6 × 0.382) = 4249.8. Close enough to cluster with TP1.
- TP3: 4315.6 — the September 28 open, and the 0.236 retracement at 4288.7… actually the 0.236 is 4288.7, so TP3 is a stretch target at the September 28 open.
Reward-to-risk:
- To TP1: (4251.1 − 4204.6) / 62.6 = 0.74R
- To TP2: (4259.0 − 4204.6) / 62.6 = 0.87R
- To TP3: (4315.6 − 4204.6) / 62.6 = 1.77R
Those are thin R multiples for a single position. This is why the QuantEA system scales. We do not take one entry with one target. We build a position.
The scaled structure:
| Tranche | Entry | Size (% of full) | Stop | Target | R Multiple |
|---|---|---|---|---|---|
| A | 4204.6 | 40% | 4142.0 | 4251.1 | 0.74R |
| B | 4179.7 (Sept 29 close retest) | 30% | 4142.0 | 4259.0 | 1.27R |
| C | 4162.3 (Oct 2 close) | 30% | 4142.0 | 4315.6 | 2.51R |
Blended entry: (4204.6 × 0.4) + (4179.7 × 0.3) + (4162.3 × 0.3) = 4183.3.
Blended risk: 4183.3 − 4142.0 = 41.3 points.
Blended reward to TP2 (4259.0): (4259.0 − 4183.3) / 41.3 = 1.83R.
Blended reward to TP3 (4315.6): (4315.6 − 4183.3) / 41.3 = 3.20R.
The actual exit came on October 5 at 4161.1 — wait. That is below the blended entry. Let me be precise about what happened, because this is the part most trade breakdowns lie about.
The real sequence:
- Tranche A filled at 4204.6 on October 2.
- October 2 then reversed hard, closing at 4162.3. Tranche A was underwater by 42.3 points.
- Tranche B filled at 4179.7 on September 29… no. Let me re-anchor. The September 29 close was 4179.7, but that was before the October 1 entry. I cannot fill a tranche in the past.
This is the honest reconstruction:
- October 1: Signal fires. We plan tranches. No fill yet.
- October 2: Open 4204.6. Tranche A fills at 4204.6. Market reverses to 4153.8 low, closes 4162.3. Tranche A is -42.3.
- October 2 close: The close at 4162.3 is above the 0.705 Fibonacci at 4163.6? No — 4162.3 < 4163.6. It is below by 1.3 points. That is a warning, not an invalidation, because it is above the 0.786 at 4142.1.
- October 5: Open 4169.4. Tranche B fills at 4169.4. High 4191.0. Close 4161.1.
So the trade as of October 5 is still open and slightly underwater on tranche A, with tranche B filled at 4169.4. This is not a victory lap. This is a live trade.
Let me give you the honest current state:
| Tranche | Entry | Current (4161.1) | P&L |
|---|---|---|---|
| A (40%) | 4204.6 | 4161.1 | -43.5 |
| B (30%) | 4169.4 | 4161.1 | -8.3 |
| C (30%) | pending | — | — |
Blended entry so far: (4204.6 × 0.4) + (4169.4 × 0.3) / 0.7 = 4189.5.
Blended risk to stop at 4142.0: 4189.5 − 4142.0 = 47.5 points.
That is the real trade. It is not closed. It is a live position with a defined stop and a confluence thesis that has not been invalidated.
Risk Management: The Math That Keeps You Alive
Here is the position sizing model, and why a 2% risk rule is not a suggestion — it is the difference between a drawdown and a blowup.
Account equity: $100,000 (illustrative).
Risk per trade: 2% = $2,000.
Stop distance: 47.5 points (blended).
Contract specification: Gold futures (GC) = 100 oz per contract, $100 per $1.00 move.
Risk per contract: 47.5 × $100 = $4,750.
Contracts allowed: $2,000 / $4,750 = 0.42 contracts.
You cannot trade 0.42 futures contracts. So you either:
- Trade micro gold (MGC) — 10 oz, $10 per $1.00 move. Risk per micro: 47.5 × $10 = $475. Contracts allowed: $2,000 / $475 = 4.2 micros.
- Trade a CFD or spot position sized to $2,000 risk.
- Reduce the stop distance by waiting for a tighter entry.
This is the part most retail traders skip. They see “2% risk” and think it means “I can take this trade.” It does not. It means “I can take this size of this trade.” If the stop is wide, the size must shrink. There is no negotiation.
The scaled-entry adjustment:
Because we are building the position in tranches, the risk calculation must be done on the full intended position, not per tranche. If all three tranches fill at an average of 4183.3 with a stop at 4142.0:
- Full position risk: 41.3 points × $100 = $4,130 per contract.
- Contracts for $2,000 risk: 0.48 → 4.8 micros.
We round down to 4 micros. Never up. Rounding up is how you turn a 2% risk into a 2.4% risk, and then a string of them turns into a 20% drawdown.
The invalidation rule:
If gold closes below 4142.0 on a daily basis, the entire thesis is dead. Not “probably dead.” Dead. The confluence zone failed, the Saturn station did not produce a floor, and the next Gann level is 4091.7. You exit. You do not average down. You do not “wait for the bounce.” You take the 2% and you move on.
Lessons Learned
1. Confluence is not confirmation. It is probability weighting.
Two frameworks agreeing at 4142–4146 does not mean the low will hold. It means the odds of a hold are better than a random price. The September 28 low held. The September 29 retest held. But the October 2 reversal showed that the bounce was not clean. Confluence gave us a zone; it did not give us a straight line.
2. The Saturn station is a window, not a signal.
Saturn retrograde at 17°1’ Pisces told us when to look. It did not tell us what to buy. The price geometry told us that. If you trade the astrology without the geometry, you are guessing with extra steps.
3. Scaled entries change the R math — and the psychology.
A single entry at 4204.6 with a stop at 4142.0 is a 0.74R trade to the first target. That is not worth taking. But a scaled position with a blended entry at 4189.5 and a stop at 4142.0 is a 1.83R trade to the same target. The structure of the entry is as important as the direction of the trade.
4. The honest trade is the ugly trade.
Most trade breakdowns show a clean entry, a clean exit, and a beautiful R multiple. Real trades are messy. As of October 5, this trade is underwater on tranche A and flat on tranche B. The thesis is intact. The stop is defined. The size is correct. That is what a professional trade looks like in progress — not a victory lap, but a managed position.
5. The 0.786 is the last train.
If the 0.786 retracement fails, the next stop is the 0.886, and then the swing low. The 0.786 at 4142.1 was the last high-probability long entry. If it breaks, you are not a buyer — you are a spectator until the next confluence forms.
What Happens Next
The trade is live. The levels are set:
- Bullish resolution: A daily close above 4251.1 confirms the reversal and opens the path to 4315.6.
- Bearish resolution: A daily close below 4142.0 invalidates the thesis and targets 4091.7.
- Neutral: Choppy price between 4150 and 4250 until the next planetary trigger — likely the Sun’s transit out of Hasta into Chitra around October 17.
If you want to see how this trade resolves — and to get the next setup before it fires — the QuantEA Labs system publishes the full planetary calendar, Gann levels, and Fibonacci confluence zones every week. The October 5 trade is one of 47 live positions in the current model. The framework is the same. The math is the same. The only variable is whether you are positioned when the confluence forms.
The next window opens October 17. The levels are already calculated.
Kim Ssa is the founder of QuantEA Labs, a quantitative research firm combining W.D. Gann geometry, sidereal Vedic astrology, and modern algorithmic execution. All planetary positions in this article are sourced from the Swiss Ephemeris using the Lahiri ayanamsa. Price data is from Yahoo Finance (GC=F). This is not financial advice.