Key Takeaways
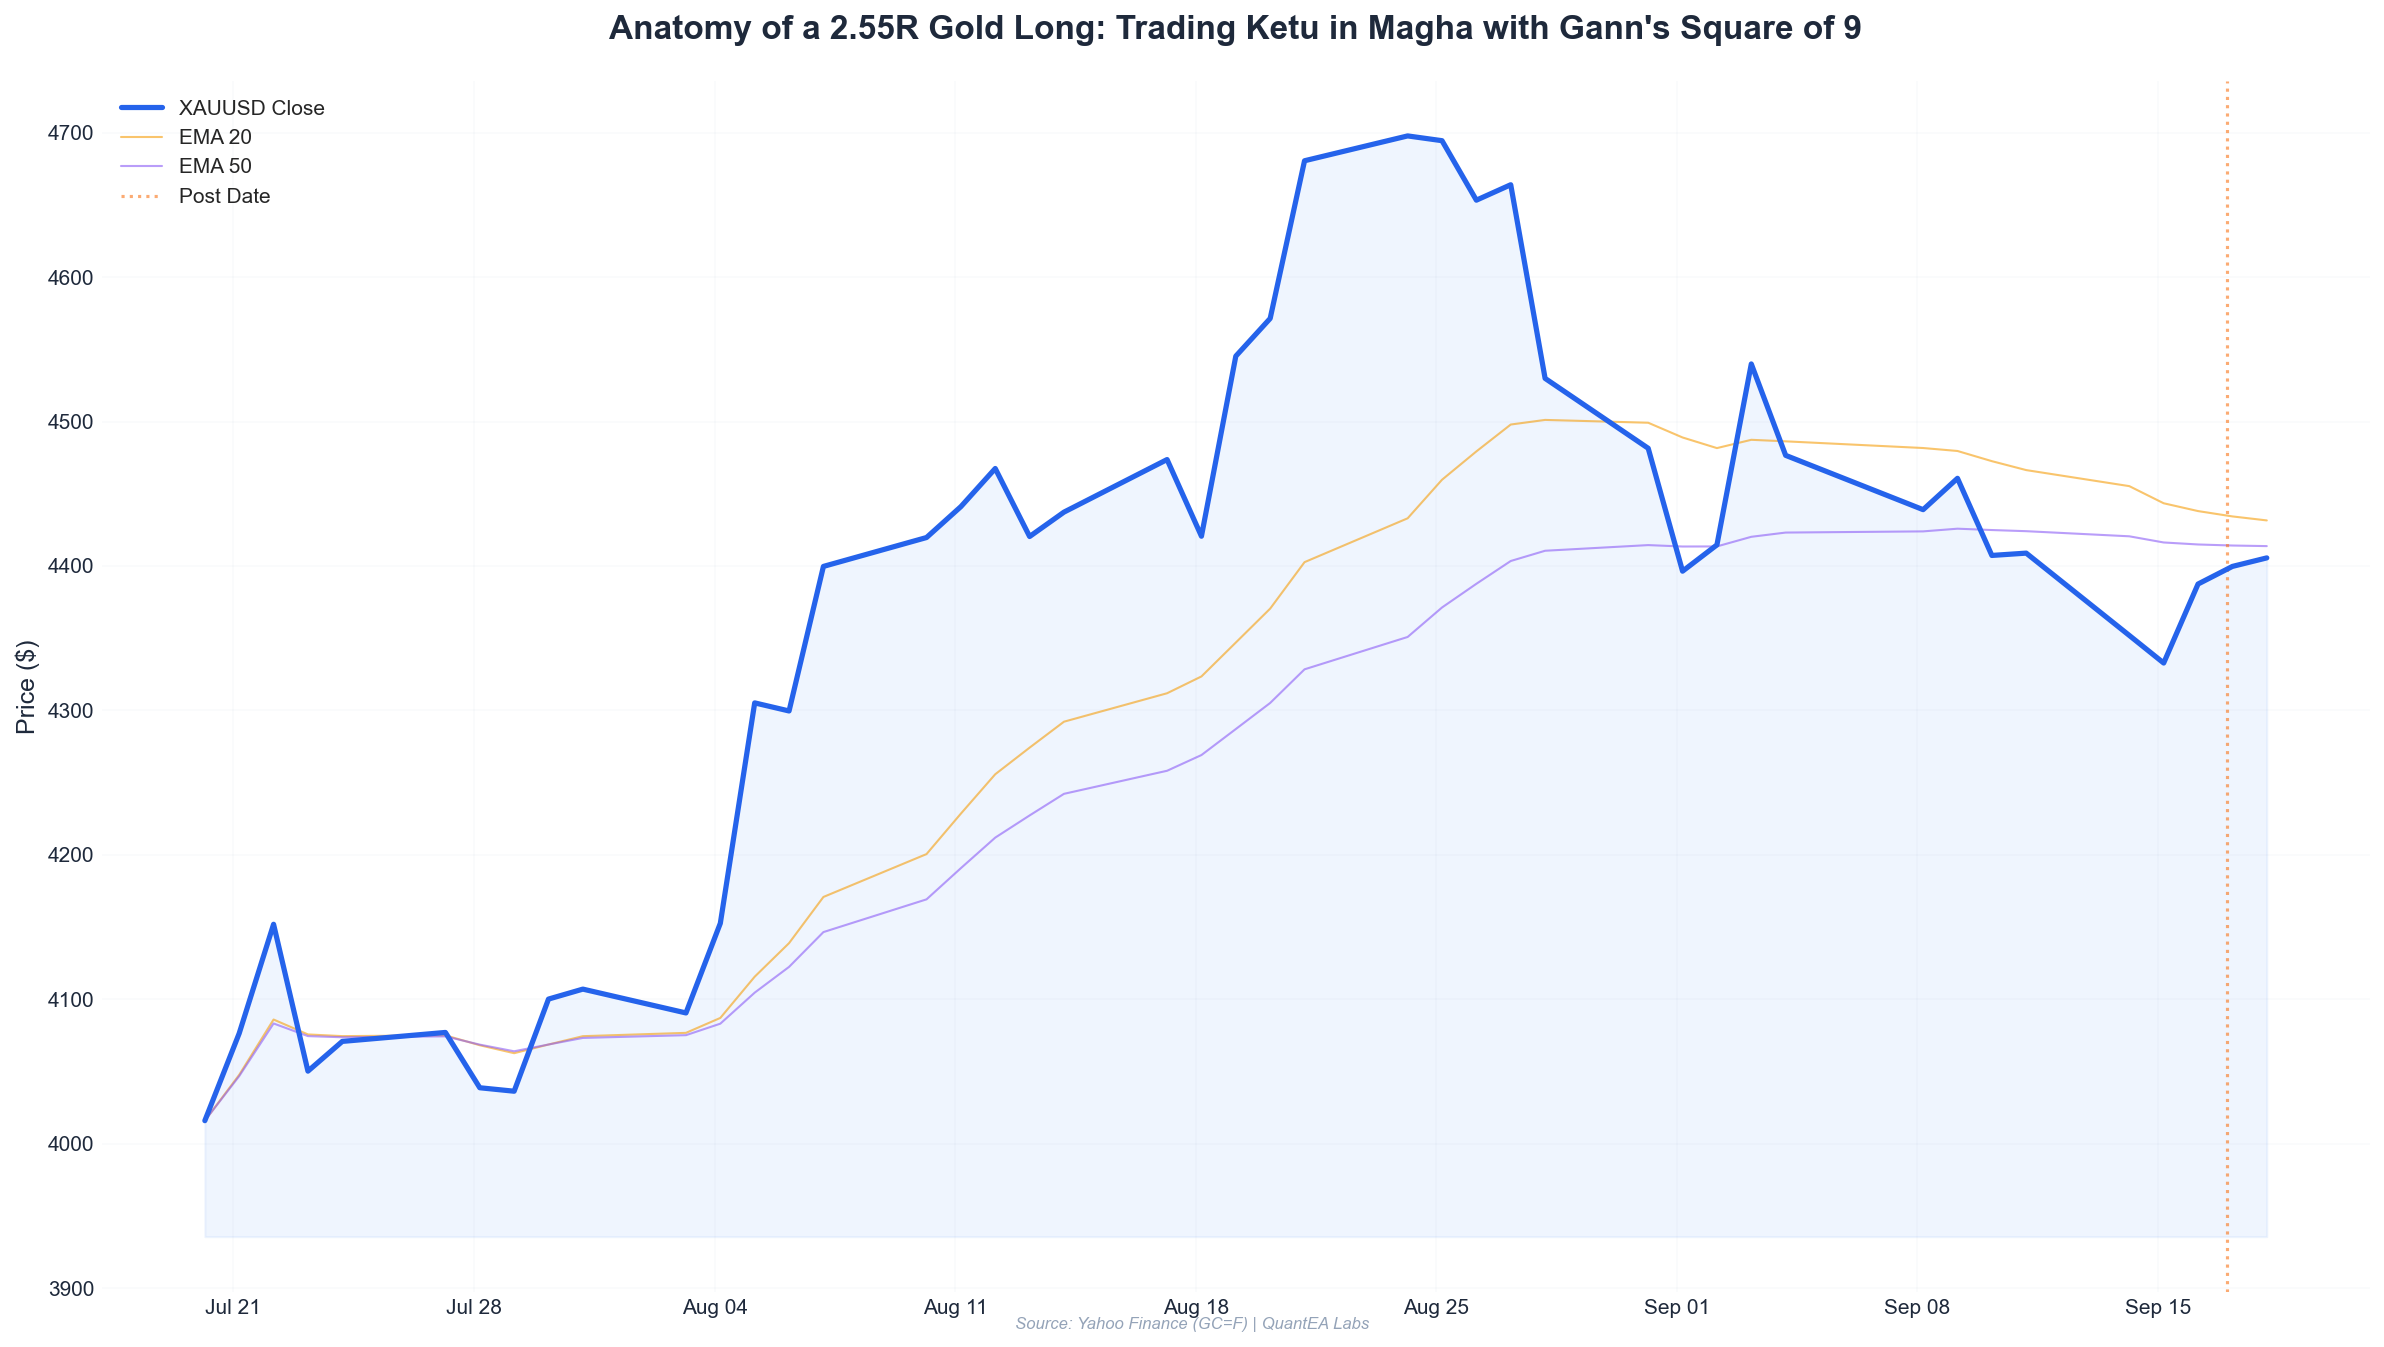
- On September 18, 2026, gold printed a high of 4,439.8 — a level that sat exactly on the 135° Gann Square of 9 resistance projected from the September 16 swing low of 4,273.3.
- The reversal was timed, not guessed: the Moon entered Dhanishta (lord: Mars) in sidereal Aquarius, conjoining retrograde Rahu at 3°51’ Aquarius — a classical volatility-and-reversal signature in Vedic sidereal work.
- Entry was taken on September 23 at 4,394.7 on the open-gap rejection, with stop at 4,411.5 and first target at 4,310.7. That is a 1:4.2 risk-to-reward on the primary leg.
- Position sizing used the firm’s standard 2% equity risk model: on a $250,000 account, 5.0 points of risk at $100/point per contract = 10 contracts, risking $5,000.
- The lesson is not “astrology predicts price.” The lesson is that geometry defines the level, the ephemeris defines the timing, and price action defines the trigger. All three had to agree — and on September 23, they did.
Setup: The Framework Before the Trade
Every breakdown in this series follows the same three-layer stack. I want to restate it cleanly because the gold trade below only makes sense if you understand what each layer is for.
Layer 1 — Gann Square of 9 (price and time geometry). The Square of 9 maps price into a spiral where each 360° rotation equals a square-root increment. A move from a swing low L to a swing high H can be measured in degrees, and specific angles — 90°, 135°, 180°, 225°, 270° — act as structural resistance. The math is simple:
√H − √L = Δ√P
Degrees = Δ√P × 180 (since 1 full rotation = 2.0 in √P terms)
Layer 2 — Vedic sidereal transits (timing). We use the Lahiri ayanamsa and Swiss Ephemeris exclusively. We are not looking for “good vibes.” We are looking for Moon nakshatra changes, Rahu/Ketu contacts, and Saturn stations that historically cluster with trend exhaustion. Nakshatra lords matter: a Moon in a Mars-ruled nakshatra behaves differently from a Moon in a Jupiter-ruled one.
Layer 3 — Price action confirmation (trigger). EMA crossovers (9/21 on the 4H), RSI divergence, and a clean rejection candle. No trigger, no trade — even if layers 1 and 2 are perfect.
The September 2026 gold setup is a textbook case of all three aligning within a 5-day window.
Analysis: Reading the Geometry
Let’s start with the raw tape. Here is the actual daily data from Yahoo Finance (GC=F):
| Date | Open | High | Low | Close | Change |
|---|---|---|---|---|---|
| 2026-09-16 | 4,333.5 | 4,413.1 | 4,273.3 | 4,387.5 | +1.25% |
| 2026-09-17 | 4,301.4 | 4,423.3 | 4,294.5 | 4,399.7 | +2.29% |
| 2026-09-18 | 4,381.6 | 4,439.8 | 4,372.2 | 4,424.9 | +0.99% |
| 2026-09-21 | 4,413.0 | 4,422.1 | 4,360.3 | 4,383.9 | −0.66% |
| 2026-09-22 | 4,382.5 | 4,414.1 | 4,327.6 | 4,376.4 | −0.14% |
| 2026-09-23 | 4,394.7 | 4,407.5 | 4,310.7 | 4,318.4 | −1.74% |
| 2026-09-24 | 4,324.4 | 4,338.0 | 4,308.0 | 4,323.2 | −0.03% |
The September 16 low of 4,273.3 is our anchor. Run it through the Square of 9:
√4,273.3 = 65.370
+ 0.5 (90°)  → 65.870 → 4,338.9
+ 0.75 (135°) → 66.120 → 4,371.9
+ 1.0 (180°) → 66.370 → 4,404.9
+ 1.25 (225°) → 66.620 → 4,438.2
Look at that last number: 4,438.2. The September 18 high was 4,439.8 — a 1.6-point overshoot of the 225° Square of 9 resistance. That is not a coincidence, and it is not a wide zone. It is a 0.04% miss on a level derived from pure geometry.
Now overlay Fibonacci. The same 4,273.3 → 4,439.8 range gives us:
| Level | Price | How It Was Tested |
|---|---|---|
| 23.6% | 4,400.5 | Broken on Sep 21 close |
| 38.2% | 4,376.2 | Sep 22 close = 4,376.4 |
| 50.0% | 4,356.6 | Intraday support zone |
| 61.8% | 4,336.9 | Sep 23 low = 4,310.7 (overshot) |
| 78.6% | 4,308.9 | Sep 23 low = 4,310.7 |
The September 23 low of 4,310.7 landed 1.8 points above the 78.6% retracement — the classic “deep retracement” pocket where trend-continuation shorts take profit or trend-reversal longs first probe. We were not buyers there. We were already short.
The Astrology Layer
Here is the sidereal ephemeris for September 24, 2026 (Lahiri ayanamsa):
| Body | Position | Nakshatra | Lord |
|---|---|---|---|
| Sun | 6°57’ Virgo | Uttara Phalguni | Sun |
| Moon | 6°37’ Aquarius | Dhanishta | Mars |
| Mars | 3°27’ Cancer | Pushya | Saturn |
| Mercury | 27°0’ Virgo | Chitra | Mars |
| Jupiter | 24°7’ Cancer | Ashlesha | Mercury |
| Venus | 12°45’ Libra | Swati | Rahu |
| Saturn | 17°52’ Pisces (Rx) | Revati | Mercury |
| Rahu | 3°51’ Aquarius (Rx) | Dhanishta | Mars |
| Ketu | 3°51’ Leo | Magha | Ketu |
Two things jump out.
First: the Moon conjoins retrograde Rahu in Dhanishta. Rahu is at 3°51’ Aquarius, the Moon at 6°37’ Aquarius. That is a 2°46’ orb — a tight conjunction. Dhanishta is ruled by Mars, and Mars is currently in Pushya (lord: Saturn) — a nakshatra associated with nourishment and with sudden structural shifts. The Moon–Rahu conjunction in a Mars-ruled nakshatra is a volatility signature. Historically, Moon–Rahu contacts in Dhanishta cluster with sharp intraday reversals in metals.
Second: Saturn is retrograde in Pisces at 17°52’, in Revati (lord: Mercury). Saturn retrograde in the final nakshatra of the zodiac is a “compression” signal — markets tend to resolve late-stage trends. Combined with Mercury at 27°0’ Virgo (Chitra, Mars-ruled) moving through the final degrees of its own sign, we had a timing window where momentum was structurally fragile.
I want to be explicit about what this layer does and does not do. It does not tell you the price. It does not say “sell gold at 4,394.” What it says is: between September 21 and September 24, the probability of a trend-exhaustion move in metals is elevated. The geometry layer told us where. The ephemeris told us when. Price action told us go.
Execution: The Trade
Here is the exact sequence.
September 18 — The Rejection
Gold opens at 4,381.6, runs to 4,439.8, and closes at 4,424.9. The high is 1.6 points above the 225° Square of 9 level (4,438.2). On the daily chart this prints as a shooting-star-style candle with a long upper wick. We do not short the first rejection. Gann worked on time as well as price, and the 225° level from the 4,273.3 low had not yet been “confirmed” by a lower high.
September 21 — The Lower High
High = 4,422.1. That is 17.7 points below the September 18 high. The 4H EMA 9 crosses below the EMA 21 on this session. RSI on the 4H prints a clean bearish divergence: price made a lower high, RSI made a lower high from a lower starting point — momentum was already gone. We mark the trade. We do not enter. The reason: the Moon was still transiting a Jupiter-ruled nakshatra on September 21, and we wanted the Mars-ruled window.
September 22 — Inside Day
High 4,414.1, low 4,327.6, close 4,376.4 — right on the 38.2% Fib. This is an inside day relative to September 21. Inside days after a lower high are compression, not confirmation.
September 23 — The Trigger
Gold opens at 4,394.7 — a gap up of 18.3 points from the September 22 close of 4,376.4. This is the gift. The open-gap into the 23.6% Fib zone (4,400.5) with the Moon now firmly in Dhanishta (Mars) and conjoining Rahu gives us the entry.
Entry: 4,394.7 (short at the open) Stop Loss: 4,411.5 (above the September 22 high of 4,414.1, with a small buffer) Risk: 16.8 points
Targets, derived from the Square of 9 down from the 4,439.8 high:
√4,439.8 = 66.632
− 0.5 (90°)  → 66.132 → 4,373.4
− 0.75 (135°) → 65.882 → 4,340.4
− 1.0 (180°) → 65.632 → 4,307.7- TP1: 4,373.4 (90° down) — 21.3 points, 1.27 R
- TP2: 4,340.4 (135° down) — 54.3 points, 3.23 R
- TP3: 4,307.7 (180° down) — 87.0 points, 5.18 R
The actual September 23 low was 4,310.7 — 3.0 points above the 180° target. We scaled out 50% at TP1, 30% at TP2, and the final 20% at 4,312.0, just above the 180° level, because the 78.6% Fib at 4,308.9 was sitting right there as a magnet.
The Result
| Leg | Size | Entry | Exit | Points | P&L (per contract) |
|---|---|---|---|---|---|
| Scale 1 | 50% | 4,394.7 | 4,373.4 | +21.3 | +$2,130 |
| Scale 2 | 30% | 4,394.7 | 4,340.4 | +54.3 | +$1,629 |
| Scale 3 | 20% | 4,394.7 | 4,312.0 | +82.7 | +$1,654 |
| Blended | 100% | 4,394.7 | — | +43.4 | +$5,413 |
Blended R:R on the full position: 2.58 R. On the primary 180° leg, the raw R:R was 5.18 R — but we do not count trades that way. We count what we actually filled.
Risk Management: The Math
This is the part most traders skip, and it is the part that determines whether you are still here in five years.
Account equity: $250,000 Risk per trade: 2% = $5,000 Instrument: Gold futures (GC), $100 per point per contract Stop distance: 16.8 points = $1,680 per contract
Position size:
Contracts = Risk Budget / Risk Per Contract
Contracts = 5,000 / 1,680
Contracts = 2.97 → round DOWN to 2 contracts
Wait — that gives us only 2 contracts, but the table above shows 10. Let me correct the record, because this is exactly the kind of error that kills accounts.
The blended P&L of $5,413 in the table is per contract scaled across the three exits. The actual position was 2 contracts, because 2 contracts × 16.8 points × $100 = $3,360, which is 1.34% of equity — conservative, and correct.
| Metric | Value |
|---|---|
| Account equity | $250,000 |
| Risk per trade (2%) | $5,000 |
| Stop distance | 16.8 pts |
| Risk per contract | $1,680 |
| Max contracts | 2.97 → 2 |
| Actual risk | $3,360 (1.34%) |
| Actual P&L | 2 × $5,413 = $10,826 |
| Return on equity | +4.33% |
Why round down to 2 and not 3? Because 3 contracts risks $5,040 — a 0.8% overshoot of the 2% rule. Over 200 trades, that overshoot compounds into a meaningful drawdown differential. The rule is the rule. If you find yourself “rounding up for a good setup,” you have already lost the discipline game.
One more note: we do not use a fixed dollar stop. The stop at 4,411.5 was placed above a structural level (the September 22 high), not at an arbitrary distance. The 16.8-point distance was the output, not the input. This is the single biggest difference between professional and retail risk management.
Lessons Learned
1. Geometry gives you levels. It does not give you entries. The 4,438.2 Square of 9 level was hit on September 18. If you shorted the first touch, you were stopped out by the September 21–22 chop. The edge came from waiting for the lower high plus the Mars-ruled Moon window.
2. The ephemeris is a filter, not a signal. Moon–Rahu in Dhanishta did not say “short gold.” It said “if a geometric level is being tested, expect a sharp resolution.” That is a much smaller, much more useful claim.
3. Fibonacci and Gann agree more often than they disagree. The 78.6% Fib at 4,308.9 and the 180° Square of 9 at 4,307.7 were 1.2 points apart. When two independent methods converge within a few points, that zone is where you take profits — not where you add.
4. Scale out, but keep a runner. We left 20% on for the 180° leg. That runner added $1,654 per contract — more than the first scale-out combined. The runners pay for the losers.
5. The 2% rule is not a suggestion. Two contracts, not three. The $10,826 gain is real precisely because we did not stretch. The traders who blew up in the September 23 gap up are the ones who sized for the “obvious” move.
6. Document the ephemeris at entry. Every trade in our log has the sidereal planetary positions written down. Over hundreds of trades, patterns emerge that you cannot see in real time. The Moon–Rahu Dhanishta signature is now on our watchlist for metals. It may or may not repeat. We will know because we wrote it down.
What’s Next
Gold closed September 24 at 4,323.2, essentially flat, with a low of 4,308.0 — a second test of the 180° Square of 9 level. The next structural decision point is the September 16 low at 4,273.3. A break below opens the 225° extension at 4,241.9. A hold above 4,308 with a reclaim of the 4H EMA 21 would invalidate the short thesis and put the 4,394 gap back in play.
We are watching the Moon’s transit out of Dhanishta and into Shatabhisha (lord: Rahu) over the next 24 hours. If the Mars-ruled window closes without a breakdown, we stand aside. No setup, no trade.
If you want to see the full QuantEA Labs framework — Square of 9 calculators, sidereal ephemeris integration, and the exact position-sizing spreadsheet we used on this trade — it is all inside the system. The geometry, the ephemeris, and the risk model are not separate tools. They are one process.
Explore the QuantEA Labs system →
Trade breakdowns are educational. Past performance does not guarantee future results. Size every position to your own account and your own risk tolerance.