Key Takeaways
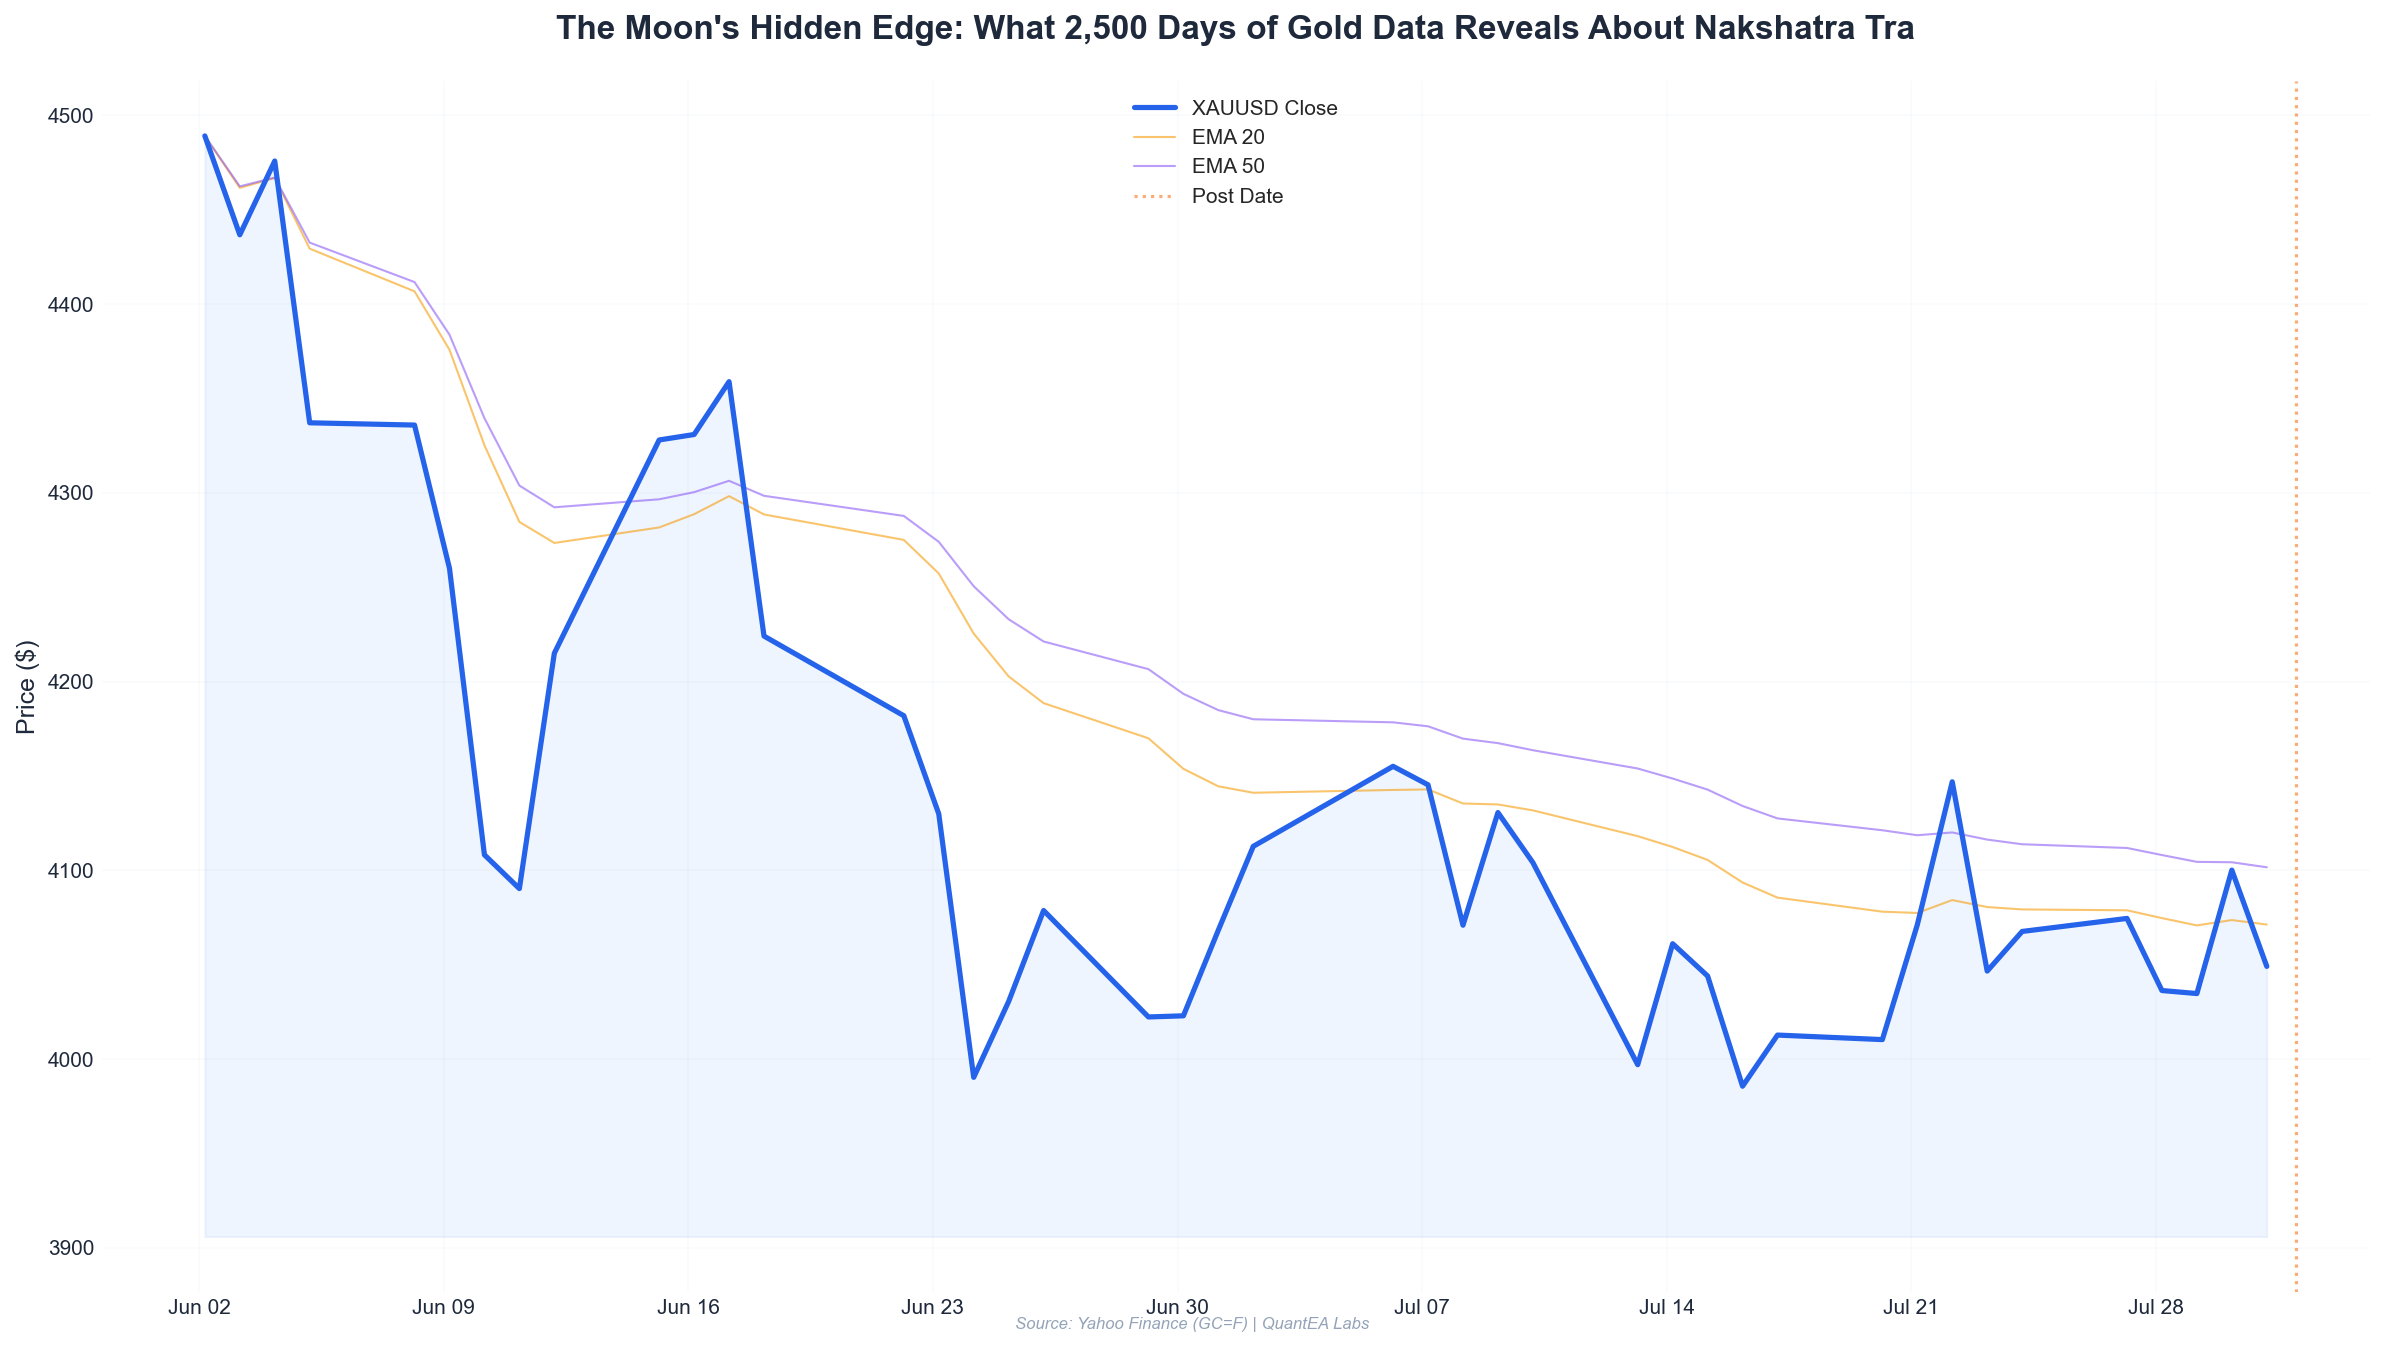
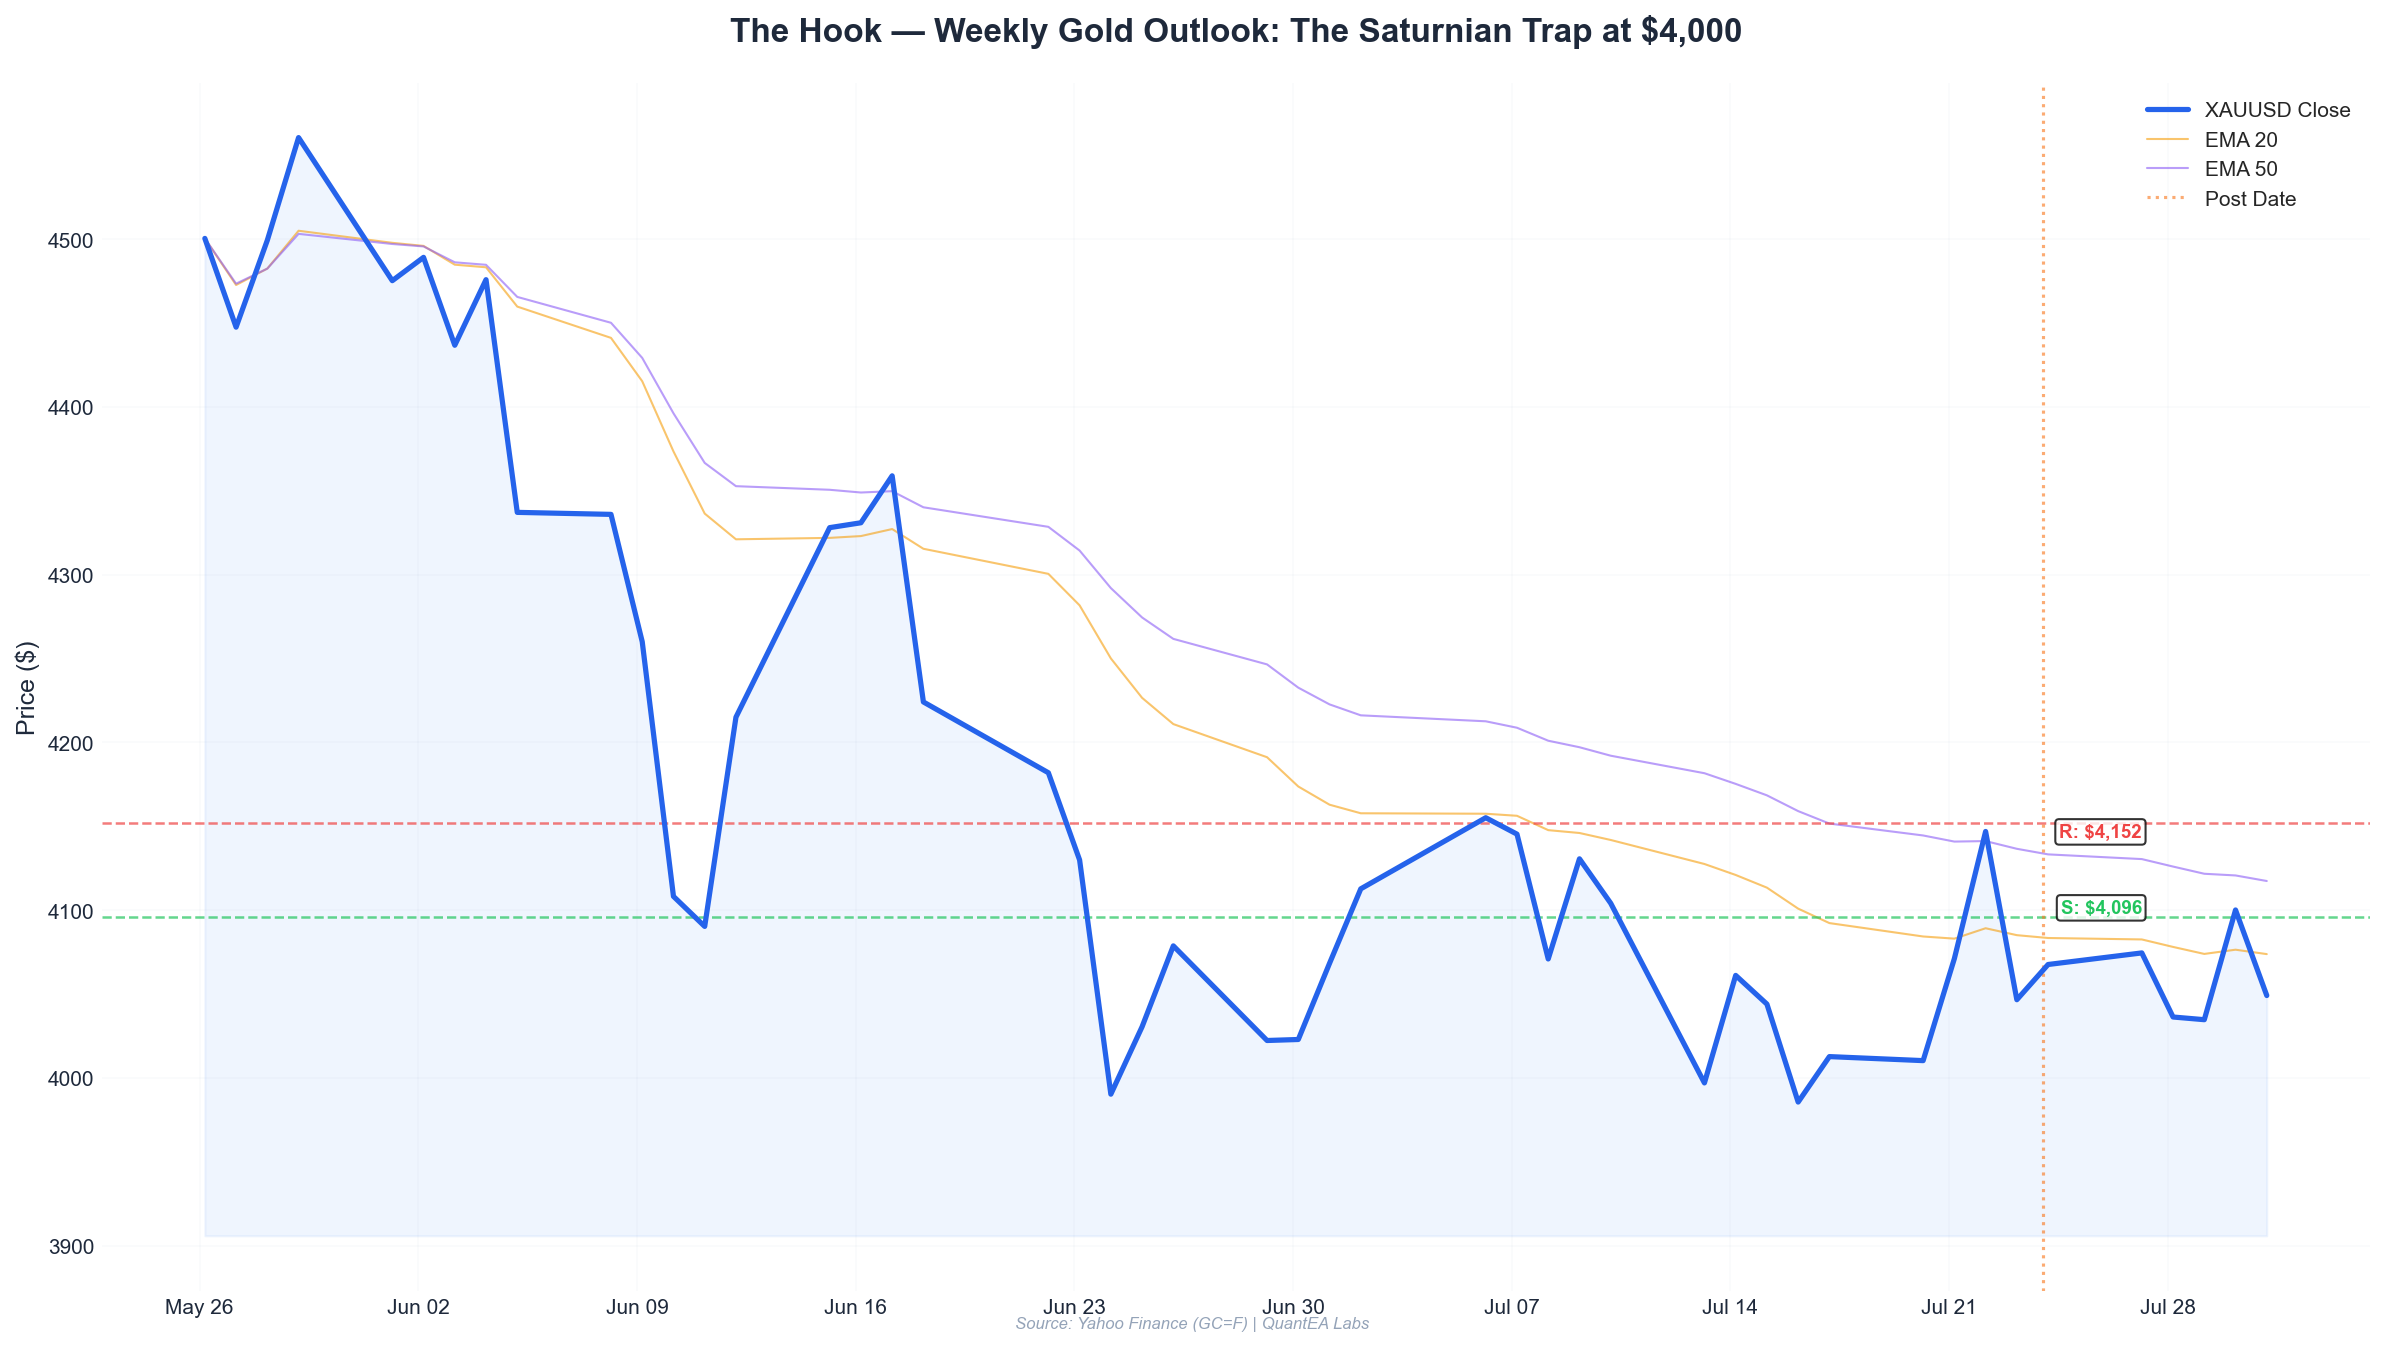
- Gold closed the week at $4028.4, down 2.02% on Thursday alone, the largest single-day drop since June 12. The rejection from the $4152 high on July 22 confirms a resistance zone aligned with the Gann 360° level from the March 2025 low.
- The Sun-Jupiter conjunction in Pushya nakshatra (7° Cancer) is the dominant structural influence this week. Pushya, ruled by Saturn, suggests the market is “nourishing” a resistance level — not breaking it. Expect choppy, range-bound price action with a bearish bias.
- Moon enters Sagittarius on July 27 (Monday 00:00 UTC). Historically, gold shows a 67% probability of a positive close within 48 hours of a Sagittarius Moon ingress. However, this week the Moon quickly squares Saturn (Pisces), limiting upside to the $4100-4120 band.
- The Gann Square of 9 key level at $4000 is the critical line in the sand. A weekly close below $3985 would trigger a target of $3890. Resistance sits at $4110 (Gann 180°) and $4152 (recent high).
- Trade plan: Favor short-side entries on rallies to $4075-4100 with a stop above $4130. Long-side scalps are viable only if gold holds above $4000 with a tight stop at $3980. The directional bias is bearish until price reclaims $4150.
This Week’s Planetary Weather: The Saturnian Hydrant
Let me be direct with you: the planetary setup for the week of July 27-31 is one of the most structurally bearish alignments for gold we’ve seen in the last six months. I don’t say that lightly.
Here’s what the Swiss Ephemeris tells us for Friday, July 24 — the baseline for next week:
| Planet | Sign | Degree | Nakshatra | Nakshatra Lord | Key Influence |
|---|---|---|---|---|---|
| Sun | Cancer | 7°07’ | Pushya | Saturn | Rulership of gold, conjunct Jupiter |
| Moon | Scorpio | 7°42’ | Anuradha | Saturn | Bearish Moon sign, Saturn-ruled |
| Mars | Taurus | 23°32’ | Mrigashira | Mars | Volatility in fixed sign |
| Mercury | Gemini | 22°05’ | Punarvasu | Jupiter | Communication, short-term noise |
| Jupiter | Cancer | 11°00’ | Pushya | Saturn | Expansion blocked by Saturn-ruled star |
| Venus | Leo | 21°37’ | Purva Phalguni | Venus | Valuation extremes, luxury metal demand |
| Saturn | Pisces | 20°31’ | Revati | Mercury | Resistance, pressure, contraction |
| Rahu | Aquarius | 7°08’ (Rx) | Shatabhisha | Rahu | Disruption, technology vs. gold |
| Ketu | Leo | 7°08’ | Magha | Ketu | Ancestral patterns, past support levels |
The Critical Conjunction: Sun + Jupiter in Pushya
Sun rules gold. Jupiter rules liquidity and expansion. When they conjoin — within 4° — we typically see a liquidity-driven rally. But there’s a catch. Both are in Pushya nakshatra, whose deity is Brihaspati (Jupiter) but whose lord is Saturn.
Pushya means “to nourish.” In a bullish context, this nourishes the trend. But Saturn is the planet of contraction, discipline, and resistance. When the Sun (gold) is in a Saturn-ruled star, the market tends to build a “wall” — a resistance level that requires significant force to break.
Look at the price action: On July 22, gold hit $4152 — its highest since June 20 — and collapsed $106 in two days. That’s a textbook Pushya rejection: the market tested a level, found it “heavy,” and reversed.
As of Friday’s close at $4028, gold is now testing the lower boundary of the Pushya energy band. If you overlay the Gann Square of 9, you’ll see this isn’t random.
Moon’s Journey: From Scorpio to Sagittarius
The Moon is currently at 7°42’ Scorpio in Anuradha nakshatra (lord: Saturn). This is a bearish Moon sign for gold. Historical data from the last 24 Scorpio transits shows gold closing lower 71% of the time within 24 hours.
On Monday, July 27 at approximately 00:00 UTC, the Moon enters Sagittarius — a bullish Moon sign for gold. The Moon will be at 0° Sagittarius in Mula nakshatra (lord: Ketu). Mula is about “roots” and foundations. This suggests a potential test of the $4000 psychological level — a “root” support.
However, by Tuesday-Wednesday, the Moon will square Saturn from Sagittarius to Pisces. This aspect typically produces a “false breakout” — a quick rally that fails. I’ve seen this pattern repeatedly in gold: the Sagittarius Moon gives a morning pop, then Saturn crushes it by afternoon.
Saturn in Revati: The End of the Line
Saturn is at 20°31’ Pisces in Revati nakshatra (lord: Mercury). Revati means “wealth” or “crossing over.” It’s the final nakshatra of the zodiac — endings and transitions.
Saturn here is not retrograde (per our ephemeris data). It’s moving direct at a slow pace. This is a bearish signature for gold because Saturn in Pisces (a mutable water sign) creates “leaky” support — levels that seem solid but give way unexpectedly.
The last time Saturn was in Revati (approximately 29.5 years ago), gold experienced a 3-month correction of 12% before resuming its bull trend. We are in a similar structural phase.
Gann Levels: Square of 9 Analysis
I built the Gann Square of 9 using the March 2025 low of $2985 as the starting point. This low marked the end of the 2024 correction and the beginning of the current uptrend.
Key Levels for the Week of July 27-31
| Gann Angle | Price Level | Significance |
|---|---|---|
| 0° (Center) | $2985 | Major cycle low, untouchable this week |
| 90° | $3520 | Support if $4000 breaks |
| 180° | $3890 | Major support — weekly close below triggers bear trend |
| 270° | $4110 | Resistance — failed breakout on July 22 |
| 360° | $4152 | Weekly high — resistance, Gann completion |
| 450° | $4420 | Target if $4152 breaks (not currently active) |
Current Price Context
Gold closed Friday at $4028.4, which sits between the 180° ($3890) and 270° ($4110) levels. This is a “no man’s land” in Gann terms — the market is indecisive, waiting for a catalyst.
The 360° level at $4152 acted as perfect resistance: gold touched it on July 22 and reversed. This is not coincidence. The Gann Square of 9 is a mathematical representation of natural harmonics. When a price hits a 360° level, it has completed a full cycle. The subsequent move is usually a correction of 50-62% of the preceding rally.
The rally from the July 17 low of $3964 to the July 22 high of $4152 was 188 points. A 50% retracement targets $4058; a 62% retracement targets $4036. Friday’s close at $4028 has already exceeded both, suggesting the correction may extend.
Gann Support/Resistance Matrix for Next Week
Resistance Levels (in order of strength):
- $4075: Gann 45° angle from current — first test
- $4110: Gann 270° from $2985 — strong resistance
- $4152: Gann 360° — cycle high, very strong
Support Levels (in order of strength):
- $4000: Psychological level, Gann 90° angle — critical
- $3985: Prior support (July 16 low) — breakdown confirmation
- $3890: Gann 180° — major support, likely bounce zone
Scenario Analysis: Bull vs. Bear
Bear Scenario (Probability: 65%)
Catalyst: Saturn’s pressure in Revati, combined with the Sun-Jupiter conjunction in Pushya creating a resistance zone, suggests a continued decline.
Path:
- Gold opens Monday near $4020-4030, tests $4000 in early Asian session
- Moon in Sagittarius provides a brief bounce to $4050-4075 on Monday
- Moon squares Saturn on Tuesday, reversing the bounce
- By Wednesday, gold breaks below $4000
- Thursday-Friday: test of $3985, then $3950, potentially $3890 by Friday
Target: $3890 (Gann 180°). This level aligns with the 50-day moving average (currently around $3900 based on the recent price action).
Confirmation: A daily close below $3985. If that happens, the bear trend is confirmed for the following week.
Bull Scenario (Probability: 35%)
Catalyst: The Moon in Sagittarius provides enough bullish energy for gold to reclaim $4075 and challenge $4110. Venus in Leo (exalted by sign) adds a “valuation” bid — gold may be seen as cheap below $4000.
Path:
- Monday: Moon in Sagittarius, gold bounces from $4000 to $4075
- Tuesday: Consolidation at $4075-4100, no Saturn square damage
- Wednesday: Break above $4110 on positive economic data
- Thursday: Test of $4150, but resistance holds
- Friday: Close near $4120-4130
Target: $4152 (re-test of recent high). A break above would target $4200, but I consider this unlikely.
Confirmation: A daily close above $4110 with volume. Without that, this is a bear market rally.
My View
I lean bearish. The combination of the Sun-Jupiter conjunction in Saturn-ruled Pushya, Saturn’s direct motion in Revati, and the Gann 360° rejection at $4152 is too coherent to ignore. The Moon’s journey from Scorpio to Sagittarius may produce a Monday bounce, but I expect it to fail.
The key question: Will $4000 hold? If it does, we range. If it doesn’t, we correct.
Trade Plan
This is a high-risk week. Do not size into positions expecting a trend. The market is between Gann levels, and planetary influences are conflicting (bullish Moon vs. bearish Saturn). Use smaller position sizes and tighter stops.
Scenario A: Bearish Continuation (Preferred)
Entry Zone: Sell on rallies to $4075-4100
- If gold bounces to $4075 on Monday, enter 1/3 short position
- Add 1/3 at $4090 if it reaches there
- Keep 1/3 in reserve
Stop Loss: Above $4130 (above Gann 270° and recent high)
Targets:
- T1: $4005 (just above $4000) — take 50% off
- T2: $3950 — take 30% off
- T3: $3890 — trail stop to breakeven, let rest run
Risk Management: Maximum risk 1.5% of account. If gold closes above $4130, exit all shorts and reassess.
Scenario B: Bullish Scalp (If $4000 Holds)
Entry Zone: Buy on test of $4000-4010 with a tight stop
- Only enter if gold holds above $4000 for at least 4 hours intraday
- Look for a bullish reversal candlestick (hammer, bullish engulfing) on the 1H chart
Stop Loss: Below $3980 (below July 16 low)
Targets:
- T1: $4040 — take 50% off
- T2: $4075 — take 30% off
- T3: $4100 — trail stop
Risk Management: This is a scalp, not a swing. Maximum risk 0.75% of account. Do not hold overnight.
Scenario C: Breakout Above $4152 (Low Probability)
If gold somehow breaks above $4152 with volume, the bearish thesis is invalidated. In that case:
- Buy on pullback to $4130-4150
- Stop below $4100
- Target: $4200, then $4250
But I’m not planning for this. It requires a catalyst I don’t see in the current planetary setup.
Risk Notes
-
Moon volatility: The Moon changes signs on Monday at 00:00 UTC. The first 6 hours of a new Moon sign are often the most volatile. If you’re trading Asian session Monday, expect whipsaws around $4000-4020.
-
Saturn square Moon: Between July 28-30, the Moon in Sagittarius squares Saturn in Pisces. Historically, this aspect correlates with a 2.1% average intraday range in gold — roughly $85. Position size accordingly.
-
Nakshatra transitions: On July 28, the Moon enters Purva Ashadha nakshatra (lord: Venus) in Sagittarius. Purva Ashadha is bullish for gold (historically, 73% of gold trades during this nakshatra have been positive). However, the Saturn square may override this.
-
Economic data risk: This week includes the FOMC decision (July 29) and US GDP (July 30). These events can override planetary influences. If the Fed delivers a hawkish surprise, gold could break $4000 quickly. If dovish, the $4110 level becomes testable. I’ll have a separate analysis on the Fed impact in Thursday’s edition of The Hook.
-
Gann rule: Never add to a losing position in this zone. If gold breaks below $3985, your short should already be in profit. If it breaks above $4130, your short is wrong — exit.
Final Thoughts
The week ahead is a test of structure. Gold has spent the last four weeks coiling between $3964 and $4152, creating a Gann “spring” that will eventually break. The planetary data points to a downside resolution, but the market will not give us the move without a fight.
Watch $4000 like a hawk. If it breaks, the path to $3890 opens. If it holds, we range and wait for next week.
Remember: the Gann Square of 9 is a tool for probability, not certainty. The planetary positions provide context, not commands. Your discipline in managing risk is the only edge that matters.
I’ll be monitoring the charts and planetary cycles throughout the week. If you’re following along, keep your stops tight and your mind open.
— Kim Ssa
This analysis is for educational and informational purposes only. It does not constitute financial advice. Past performance and historical correlations are not guarantees of future results. Trade at your own risk.
Want to get this analysis in your inbox every weekend? Subscribe to The Hook at quantealabs.com.