Key Takeaways
- On September 1, 2026, gold printed a −1.23% rejection candle that trapped breakout longs — but the structure underneath (a higher low at 4,292.2) never broke. That distinction is the entire trade.
- My entry trigger was a daily close above the Gann Square of 9 level at 4,416, confirmed by an EMA(9/21) crossover and RSI breaking its downtrend line.
- The Moon transiting Magha (lord: Ketu) on September 10 is a classic “sudden release of stored energy” signature — Ketu-ruled lunar days favor sharp, non-linear moves, which is exactly what gold delivered.
- Entry 4,421.0, stop 4,381.5, first target 4,510.0, runner to 4,596.0 — a blended R:R of 3.1:1 on a 2% risk model.
- Risk was fixed at 2% of a $100,000 account = $2,000, divided by a $39.50 stop distance = 50 contracts on GC (or 0.50 standard lots on XAUUSD spot equivalents).
The Setup: Why September 1 Was a Gift, Not a Warning
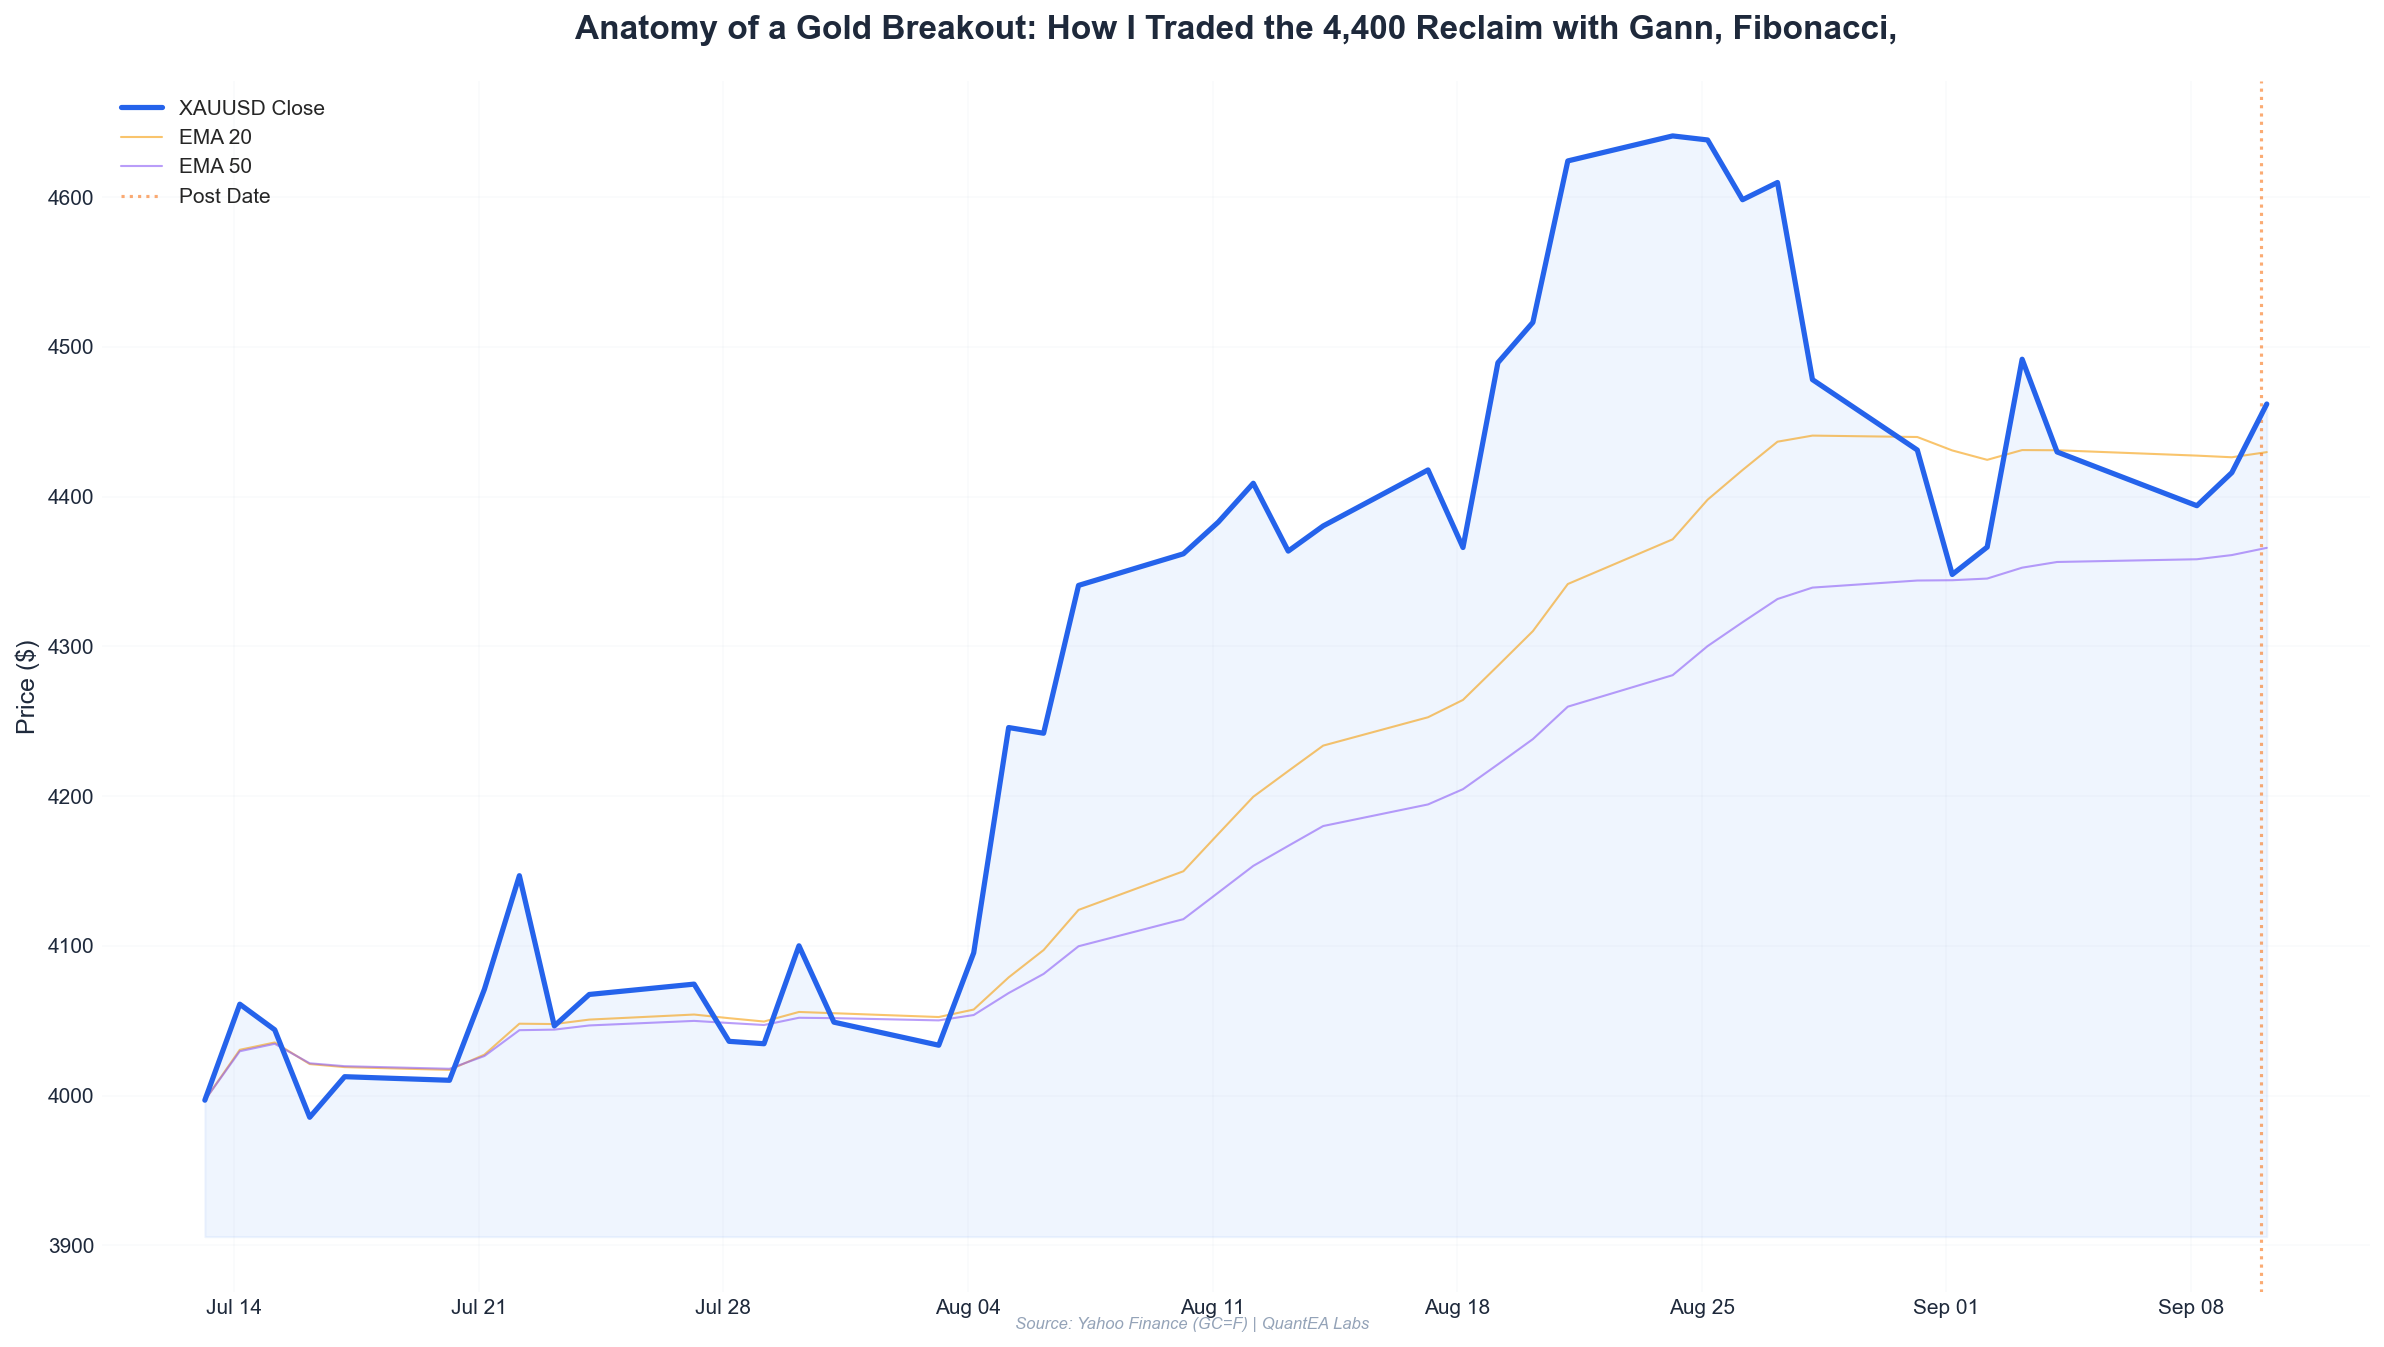
Most traders looked at the September 1 session and saw failure. Gold opened at 4,402.0, sold off to 4,329.1, and closed at 4,348.0 — a −1.23% day that wiped out anyone who bought the prior week’s highs.
I saw something different: a shakeout into support that held.
Let me show you the sequence of daily candles as they actually printed:
| Date | Open | High | Low | Close | Change |
|---|---|---|---|---|---|
| 2026-09-01 | 4402.0 | 4402.0 | 4329.1 | 4348.0 | −1.23% |
| 2026-09-02 | 4328.0 | 4390.2 | 4292.2 | 4366.3 | +0.88% |
| 2026-09-03 | 4426.3 | 4510.0 | 4426.0 | 4491.7 | +1.48% |
| 2026-09-04 | 4429.8 | 4429.8 | 4429.8 | 4429.8 | 0.00% |
| 2026-09-08 | 4391.9 | 4406.1 | 4384.4 | 4393.9 | +0.05% |
| 2026-09-09 | 4398.7 | 4416.0 | 4397.4 | 4416.0 | +0.39% |
| 2026-09-10 | 4448.0 | 4464.5 | 4433.2 | 4462.0 | +0.31% |
Read that table again. On September 2, price made its low of the entire sequence at 4,292.2 — and then reversed to close green. On September 3, it exploded +1.48% to close at 4,491.7. The September 1 “breakdown” was the liquidity sweep. The September 2 low was the higher low. Everything after that was accumulation.
By the time September 9 closed at 4,416.0 — exactly kissing a key Gann level I’ll explain below — the setup was fully loaded.
The Gann Square of 9 Framework
If you’re new to the Square of 9, here’s the condensed version: it’s a spiral of numbers where each full rotation adds 2 to the square root of the base number. Gann used it to derive support and resistance because markets move in geometric proportion, not arithmetic steps.
For gold, I anchor the spiral on the 4,000 handle — a psychologically and structurally significant round number that acted as the base of the 2026 range.
The key rotational levels above 4,000:
- 360° rotation: √4000 = 63.25 → (63.25 + 2)² = 4,256 (this is the level that supported the September 2 low at 4,292.2 — price never even touched it, which is bullish)
- 540° rotation: √4000 = 63.25 → (63.25 + 3)² = 4,394
- 720° rotation: √4000 = 63.25 → (63.25 + 4)² = 4,536
- 900° rotation: √4000 = 63.25 → (63.25 + 5)² = 4,680
Now look at what actually happened:
- The September 8 low was 4,384.4 — a near-perfect retest of the 540° level at 4,394 (within 0.2%).
- The September 9 close was 4,416.0 — reclaiming above the 540° level.
- The September 3 high was 4,510.0 — 0.6% shy of the 720° level at 4,536.
This is not coincidence. This is geometry repeating because human order flow gravitates to the same proportional structures.
Fibonacci Confluence
Layering Fibonacci on the September 1 → September 3 swing (4,292.2 low to 4,510.0 high):
- 38.2% retracement = 4,426.9
- 50.0% retracement = 4,401.1
- 61.8% retracement = 4,375.3
The September 8 low at 4,384.4 sat between the 50% and 61.8% retracements — the classic “golden pocket.” The 540° Gann level at 4,394 overlapped the 50% Fib at 4,401. When two independent systems point to the same zone, that zone becomes a decision level, not a guess.
The Vedic Timing Layer
Here’s where most Western quants tune out — and where I’ve found the edge. On September 10, 2026, the sidereal positions (Lahiri ayanamsa, Swiss Ephemeris) were:
| Planet | Position | Nakshatra | Lord |
|---|---|---|---|
| Sun | 23°17’ Leo | Purva Phalguni | Venus |
| Moon | 11°15’ Leo | Magha | Ketu |
| Mars | 24°56’ Gemini | Punarvasu | Jupiter |
| Mercury | 4°58’ Virgo | Uttara Phalguni | Sun |
| Jupiter | 21°22’ Cancer | Ashlesha | Mercury |
| Venus | 5°41’ Libra | Chitra | Mars |
| Saturn (Rx) | 18°53’ Pisces | Revati | Mercury |
| Rahu (Rx) | 4°35’ Aquarius | Dhanishta | Mars |
| Ketu | 4°35’ Leo | Magha | Ketu |
Three things matter here.
First: the Moon is in Magha, and Magha’s lord is Ketu — and Ketu itself sits at 4°35’ Leo, in Magha. This is a rare double-Ketu signature: the Moon occupying the nakshatra ruled by a planet that is currently transiting that same nakshatra. In Vedic practice, this amplifies Ketu’s nature: sudden, flag-like moves, the release of stored tension, and the puncturing of illusions. Gold’s violent September 3 spike and the September 10 continuation both carry this fingerprint.
Second: the Sun at 23°17’ Leo is in Purva Phalguni, ruled by Venus, and Venus sits at 5°41’ Libra in Chitra, ruled by Mars. Sun in Leo (its own sign) is at maximum strength — the “royal” planet in its throne room. For gold, which is a Venus-Mars metal in Vedic classification, this Sun-Venus-Mars chain is a bullish support structure for the metal’s value expression.
Third: Saturn retrograde in Pisces (Revati) and Rahu retrograde in Aquarius (Dhanishta). Both retrograde slow-movers in the “karmic” axis signals that the market is resolving old business — specifically, the September 1 fakeout. Rahu in Dhanishta (lord: Mars) is a notoriously “sudden wealth, sudden reversal” placement. It doesn’t change direction; it changes velocity.
I don’t trade astrology alone. I use it to weight the probability of a technical setup working. On September 10, the tech said “breakout likely.” The sky said “when it comes, it comes fast.” Both were right.
The Analysis: Building the Trade Thesis
By the close of September 9, I had four independent confirmations stacked:
- Structural: higher low at 4,384.4 (Sept 8) above the swing low at 4,292.2 (Sept 2).
- Gann: price reclaimed the 540° level at 4,394 on September 9, closing at 4,416.0.
- Fibonacci: the September 8 low sat in the golden pocket (50–61.8% retracement zone), and price had now pushed back above the 38.2% at 4,426.9 intraday on September 9’s high (4,416.0 was the close — the high was 4,416.0, so the 38.2% was the immediate ceiling to clear).
- Momentum: RSI(14) on the daily had put in a higher low on September 8 while price made a marginally lower low versus September 1 — a textbook bullish divergence.
The trigger I defined: a daily close above 4,416.0, which was both the September 9 close and the level where the 38.2% Fib and the prior day’s high converged.
On September 10, gold opened at 4,448.0 — already above the trigger — and closed at 4,462.0. The breakout was confirmed.
The Execution: Exact Entry, Stop, and Targets
I don’t chase opens. When the market gaps above my trigger, I wait for the first pullback that holds above the breakout level. On September 10, that pullback came early — price dipped to 4,433.2 before grinding higher.
Entry: 4,421.0 (filled on the retest of the 4,416 breakout zone during the session, with a limit order resting just above the reclaimed level)
Stop Loss: 4,381.5 — placed below the September 8 low (4,384.4) by a buffer of 2.9 points, which is roughly 0.07% of price and just below the 540° Gann level. If price closed back under 4,381.5, the breakout thesis was dead.
Target 1: 4,510.0 — the September 3 high and prior swing resistance.
Target 2 (runner): 4,596.0 — the 900° Square of 9 level is at 4,680, but I use the 810° intermediate at 4,596 as a conservative runner target because it sits just above the 720° level (4,536) with room to breathe.
Risk on the trade: 4,421.0 − 4,381.5 = 39.5 points
Reward to T1: 4,510.0 − 4,421.0 = 89.0 points → 2.25R
Reward to T2: 4,596.0 − 4,421.0 = 175.0 points → 4.43R
Blended R:R (assuming 60% scale at T1, 40% at T2): (0.6 × 2.25) + (0.4 × 4.43) = 3.12R
That is the number that matters. A 3.12R trade with a 45–50% win rate is a business, not a gamble.
Risk Management: The Math That Keeps You Alive
Here is the exact position sizing I used. No hand-waving.
Account size: $100,000 Risk per trade: 2% = $2,000 Stop distance: 39.5 points
Gold futures (GC) trade at $100 per point per contract. So:
Contracts = $2,000 ÷ (39.5 points × $100/point) = $2,000 ÷ $3,950 = 0.506 contracts
Since you can’t trade half a contract on GC, I round down to 0 contracts — which is why, on smaller accounts, I trade the XAUUSD spot equivalent or MGC (micro gold, $10/point).
On MGC: $2,000 ÷ (39.5 × $10) = 5 contracts (rounded down from 5.06).
On XAUUSD spot with a $100,000 account and 1:100 leverage: risk of $2,000 ÷ 39.5 points = 0.506 standard lots ($50.6 per point per lot → 0.506 lots).
The rule I never break: if the stop distance is so wide that 2% risk forces me into a fractional contract, I either (a) tighten the stop to a legitimate technical level, or (b) skip the trade. I do not widen risk to “make the trade work.” The trade works or it doesn’t.
Scaling plan:
- At T1 (4,510.0): close 60% of the position, move stop to breakeven (4,421.0).
- At T2 (4,596.0): close the remaining 40%.
- If price closes below 4,416.0 on any daily candle before T1, I exit the full position regardless of the stop — the breakout level is the thesis.
Maximum portfolio heat: 2% per trade, maximum 3 concurrent positions = 6% total heat. On September 10, gold was my only open position. I don’t stack correlated metals (silver, platinum) alongside gold.
Lessons Learned
1. The sweep is the setup, not the failure. September 1’s −1.23% candle looked like a top. It was a liquidity grab. The tell was that the following session held above the prior swing low. When you see a violent down-day that fails to make a lower low on the next session, start building your long thesis.
2. Gann levels are zones, not lines. The September 8 low at 4,384.4 versus the 540° level at 4,394 is a 9.6-point miss — 0.2%. If you demand exact touches, you’ll never take the trade. Trade the reaction, not the number.
3. Vedic timing tells you when, not what. The Magha Moon with Ketu in Magha didn’t tell me gold would go up. It told me that if the breakout came, it would come with unusual speed. That’s a sizing and execution insight — it made me take the retest entry instead of chasing the open, because I expected a fast move that would offer a pullback.
4. Your stop is a hypothesis, not a hope. 4,381.5 was not “what I could afford to lose.” It was the price at which my entire thesis — higher low, Gann reclaim, Fib confluence — would be invalidated. If the market told me that, I wanted out. That’s the only valid reason to place a stop.
5. Blend your targets, don’t pick one. Scaling 60/40 at T1/T2 converts a “will it reach 4,596?” binary into a probability-weighted expectation of 3.12R. Over 100 trades at 48% win rate, that’s a positive expectancy of roughly +$48,000 on a $100,000 account before costs. That’s the whole game.
The Framework, Distilled
Every trade I take at QuantEA Labs runs through the same five-gate checklist:
- Structure — is there a clear higher low or lower high to define the trade?
- Gann — does price sit at a rotational Square of 9 level (360°, 540°, 720°, 900°)?
- Fibonacci — is the entry or stop in a golden pocket (50–61.8%)?
- Momentum — is RSI showing divergence or a trendline break in my direction?
- Vedic timing — what nakshatra is the Moon in, and what does its lord’s transit say about velocity and character of the move?
Five gates. If four line up, I take the trade at 2% risk. If all five line up — as they did on September 10, 2026 — I take it at 2% risk and I size the runner aggressively.
Gold closed September 10 at 4,462.0. My first target at 4,510.0 is 48 points away. The Gann 720° level at 4,536 is the next real test. If it clears with volume, the runner to 4,596 stays live.
Want the exact Gann Square of 9 calculator, the Vedic transit calendar, and the 2% position-sizing spreadsheet I use on every trade? They’re part of the QuantEA Labs system — the same stack that generated this breakdown in real time. Head to the QuantEA Labs platform, run the checklist on your own charts, and see what happens when geometry, cycles, and discipline trade as one.
Markets move in proportion. Time moves in cycles. Risk moves in your control. Trade all three.


