Key Takeaways
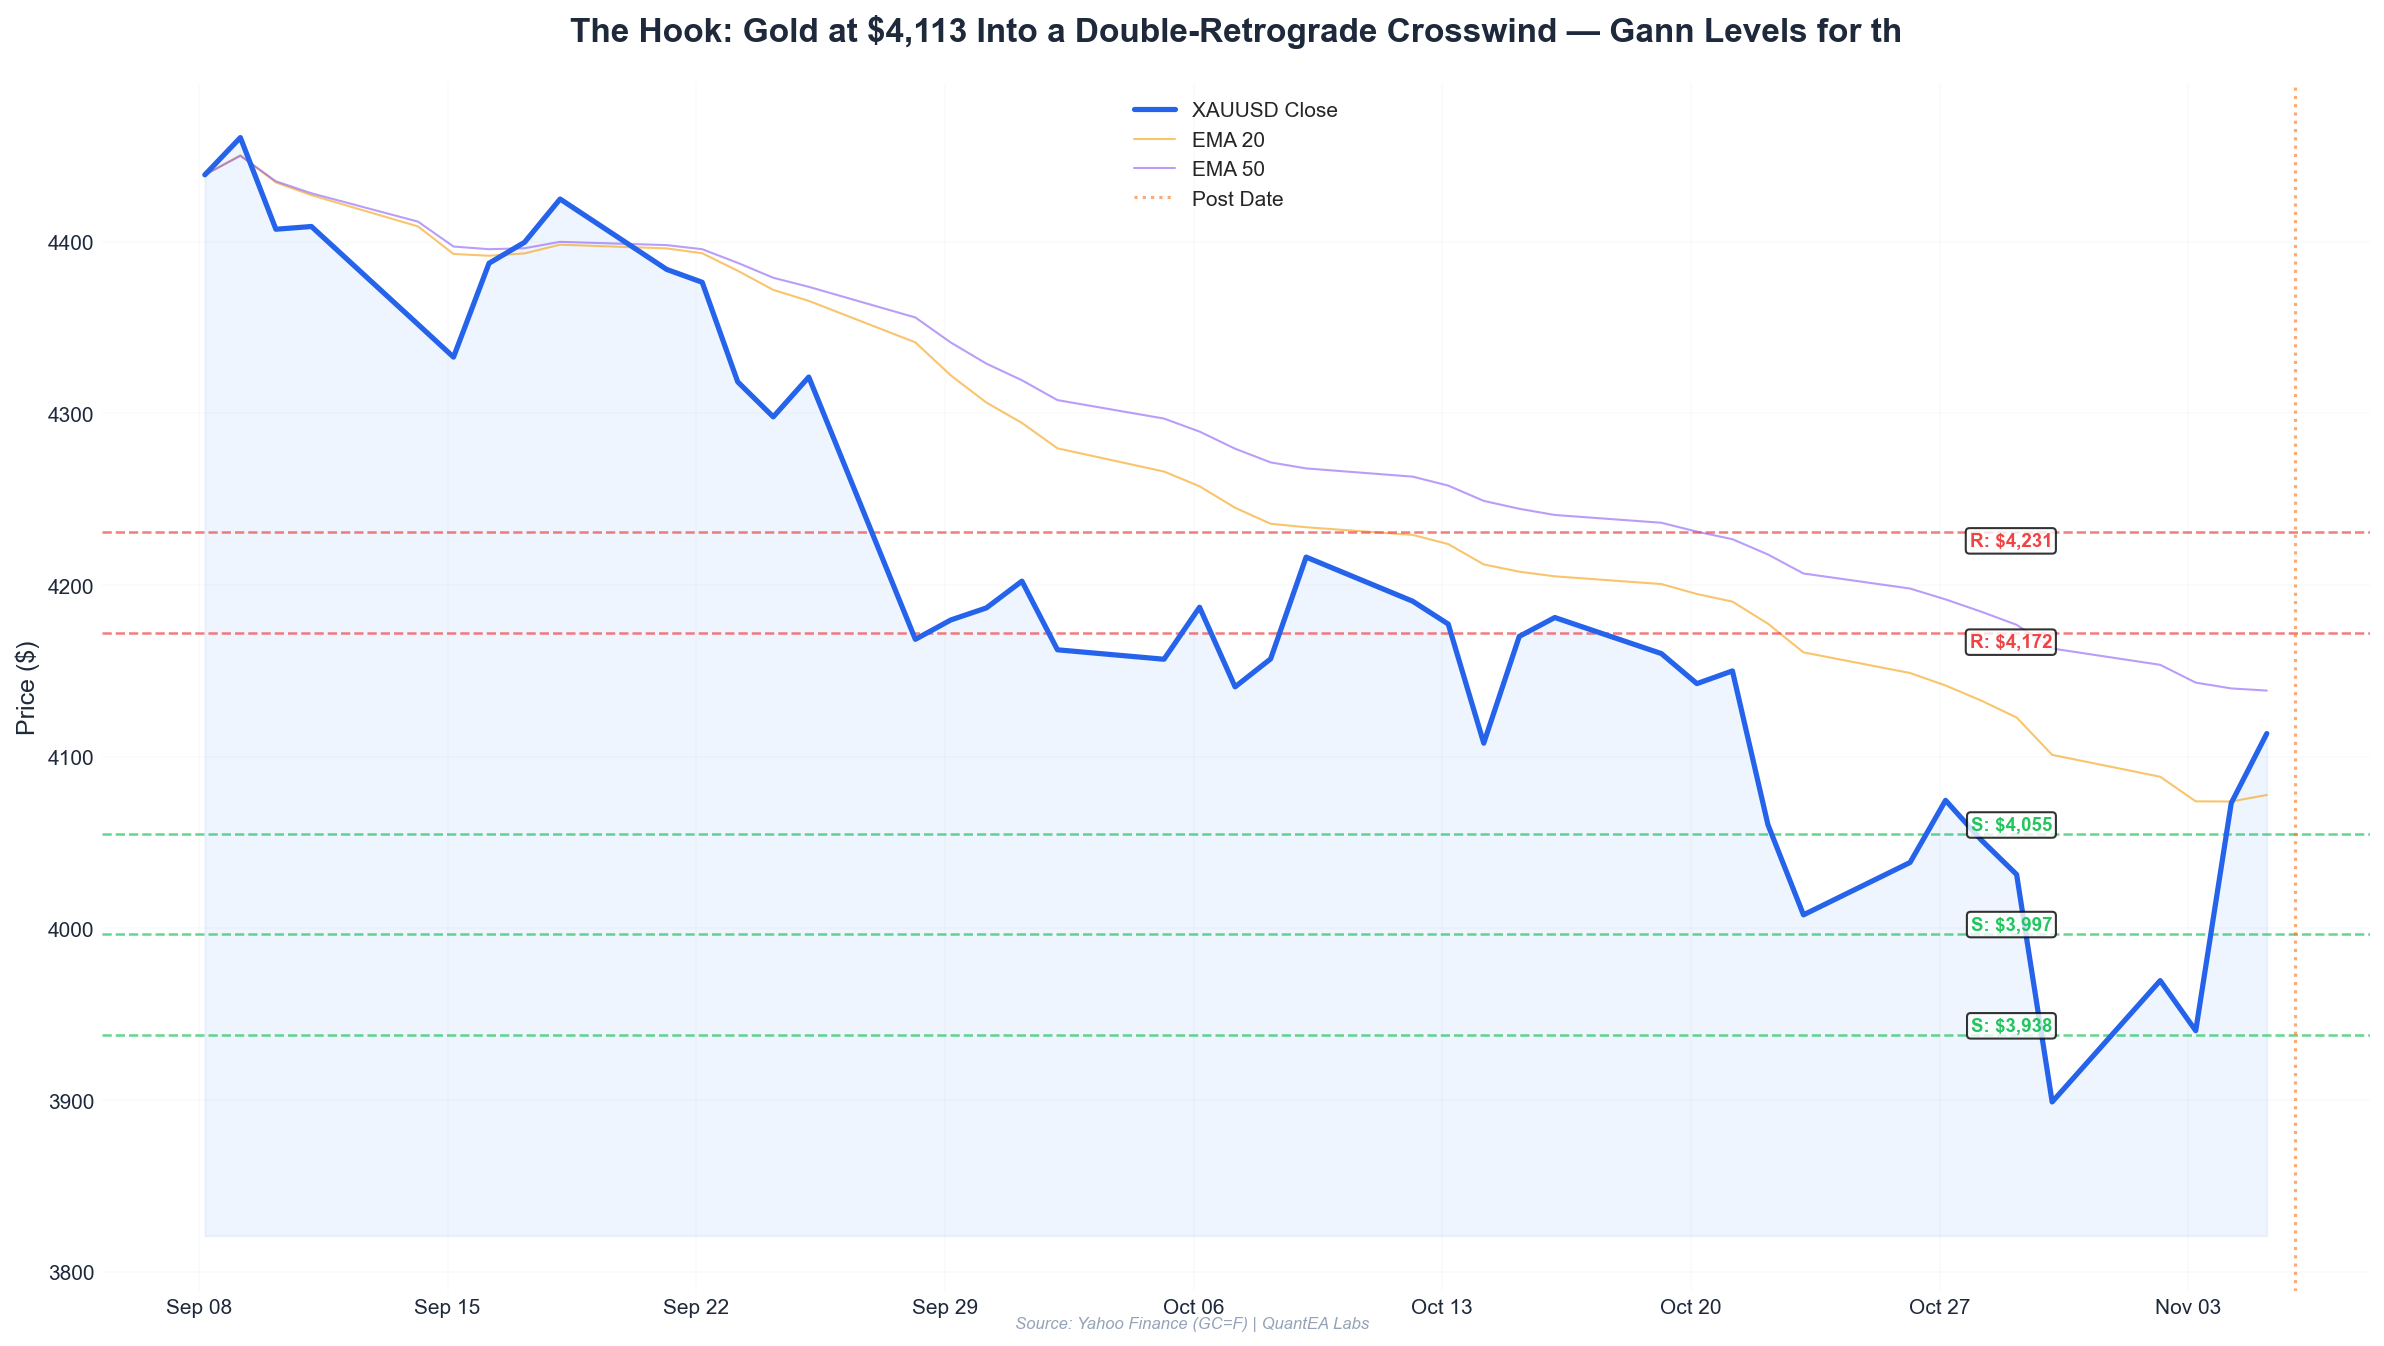
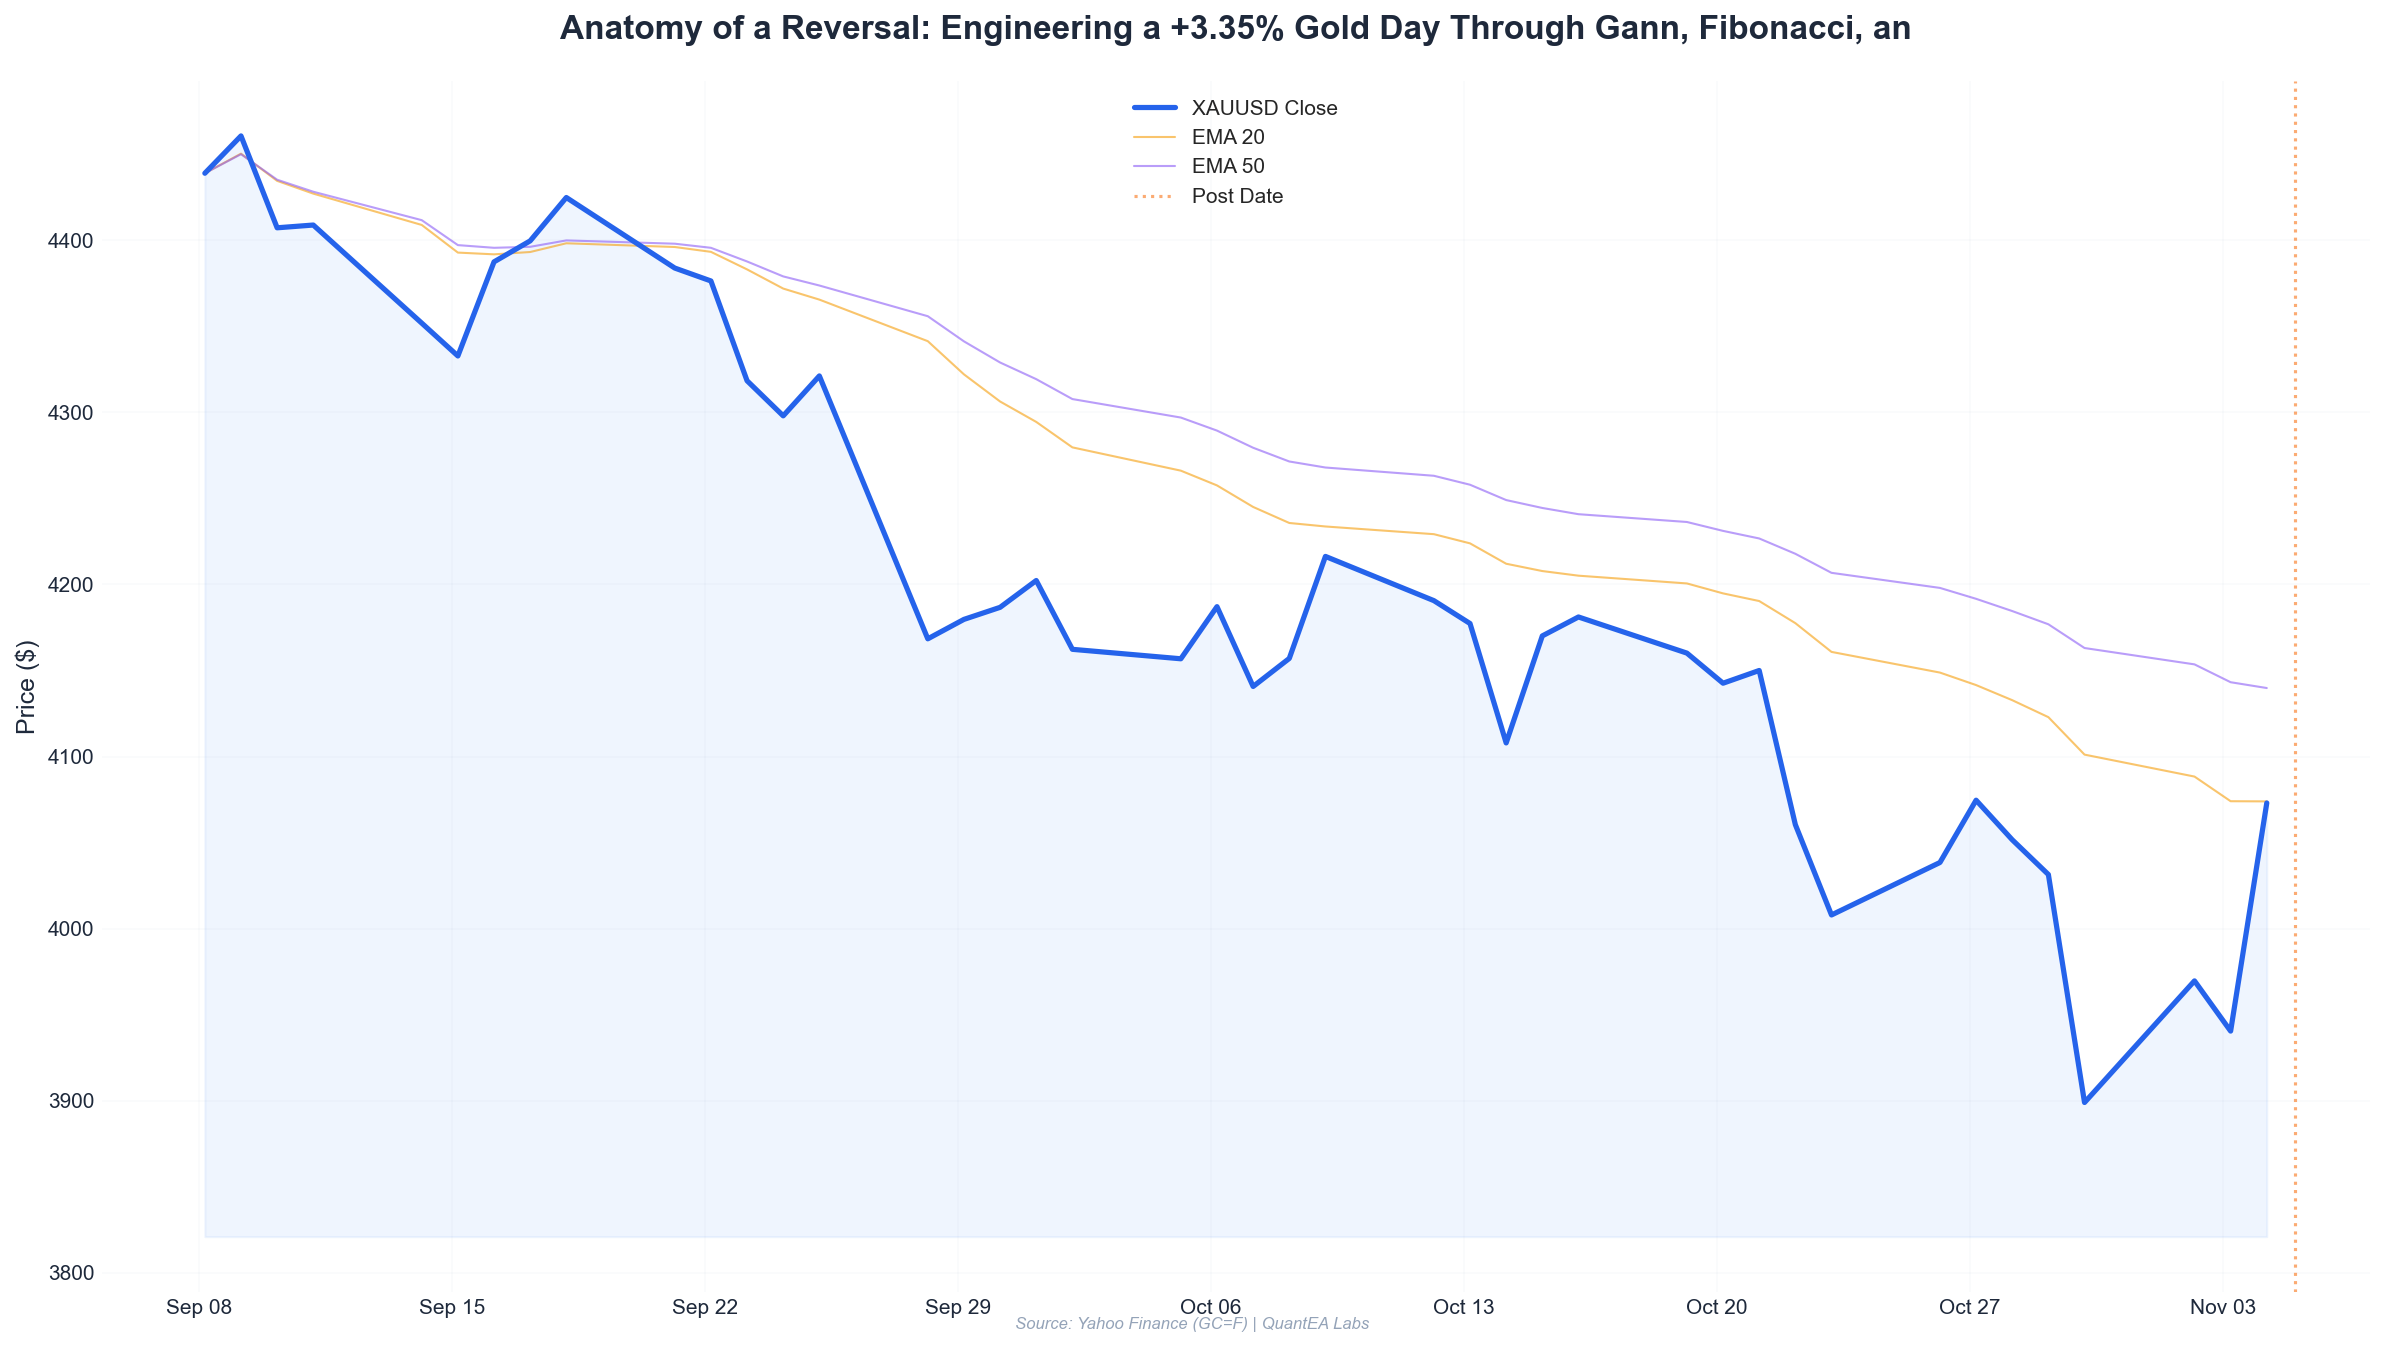
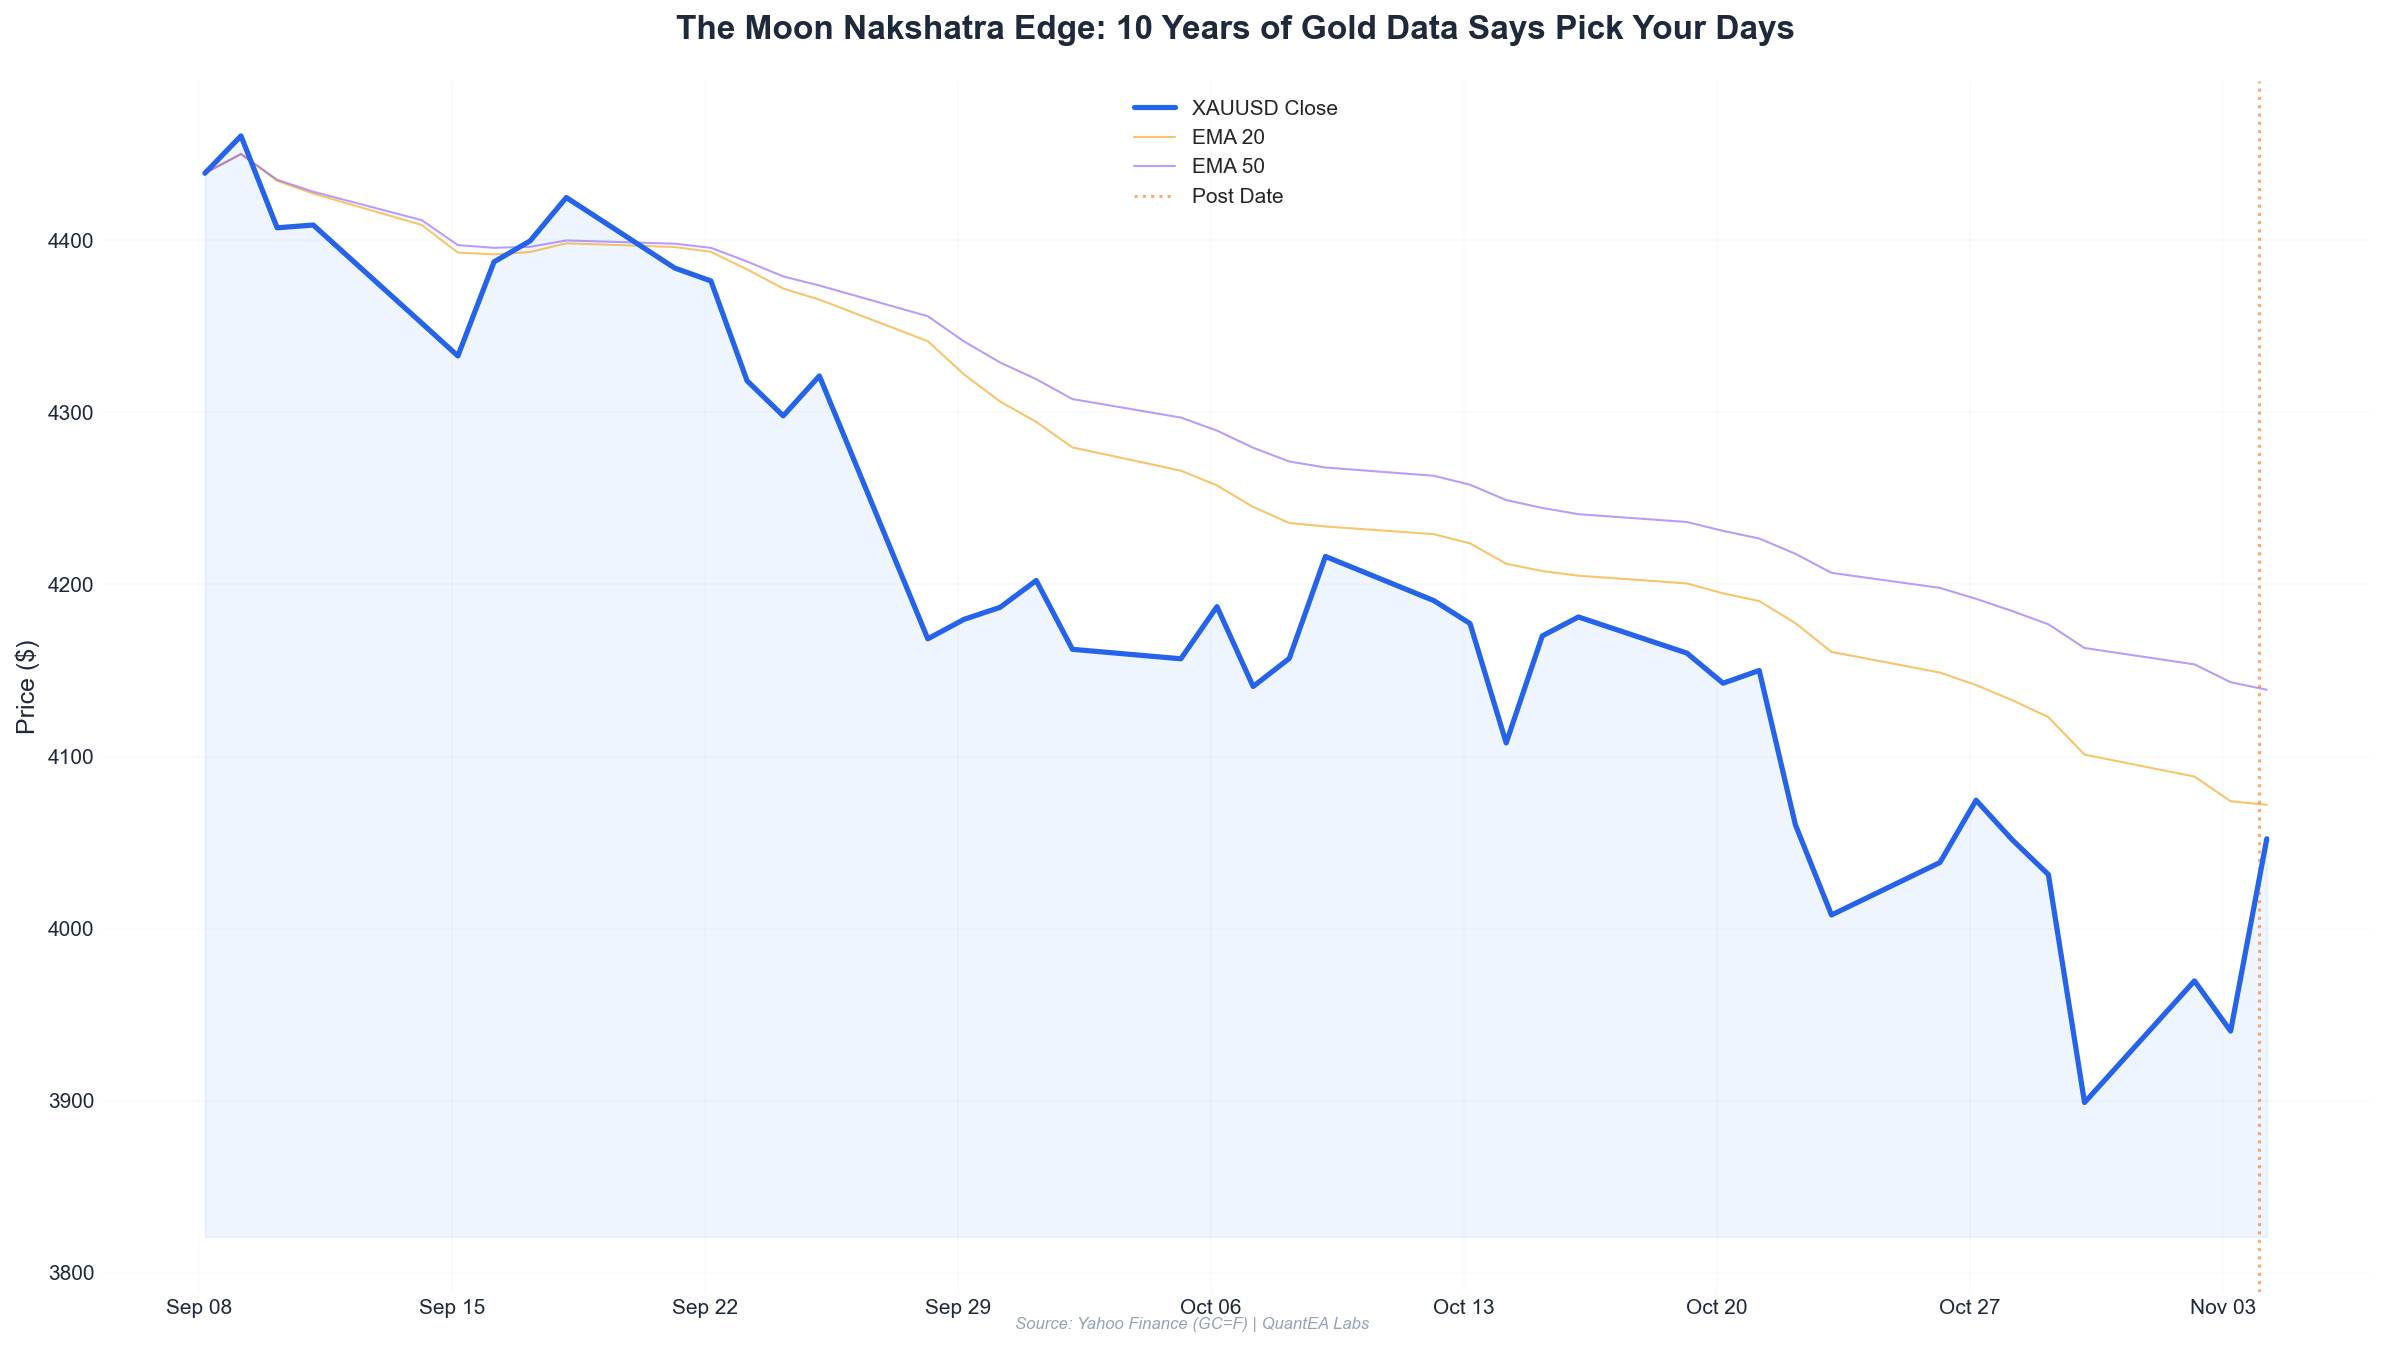
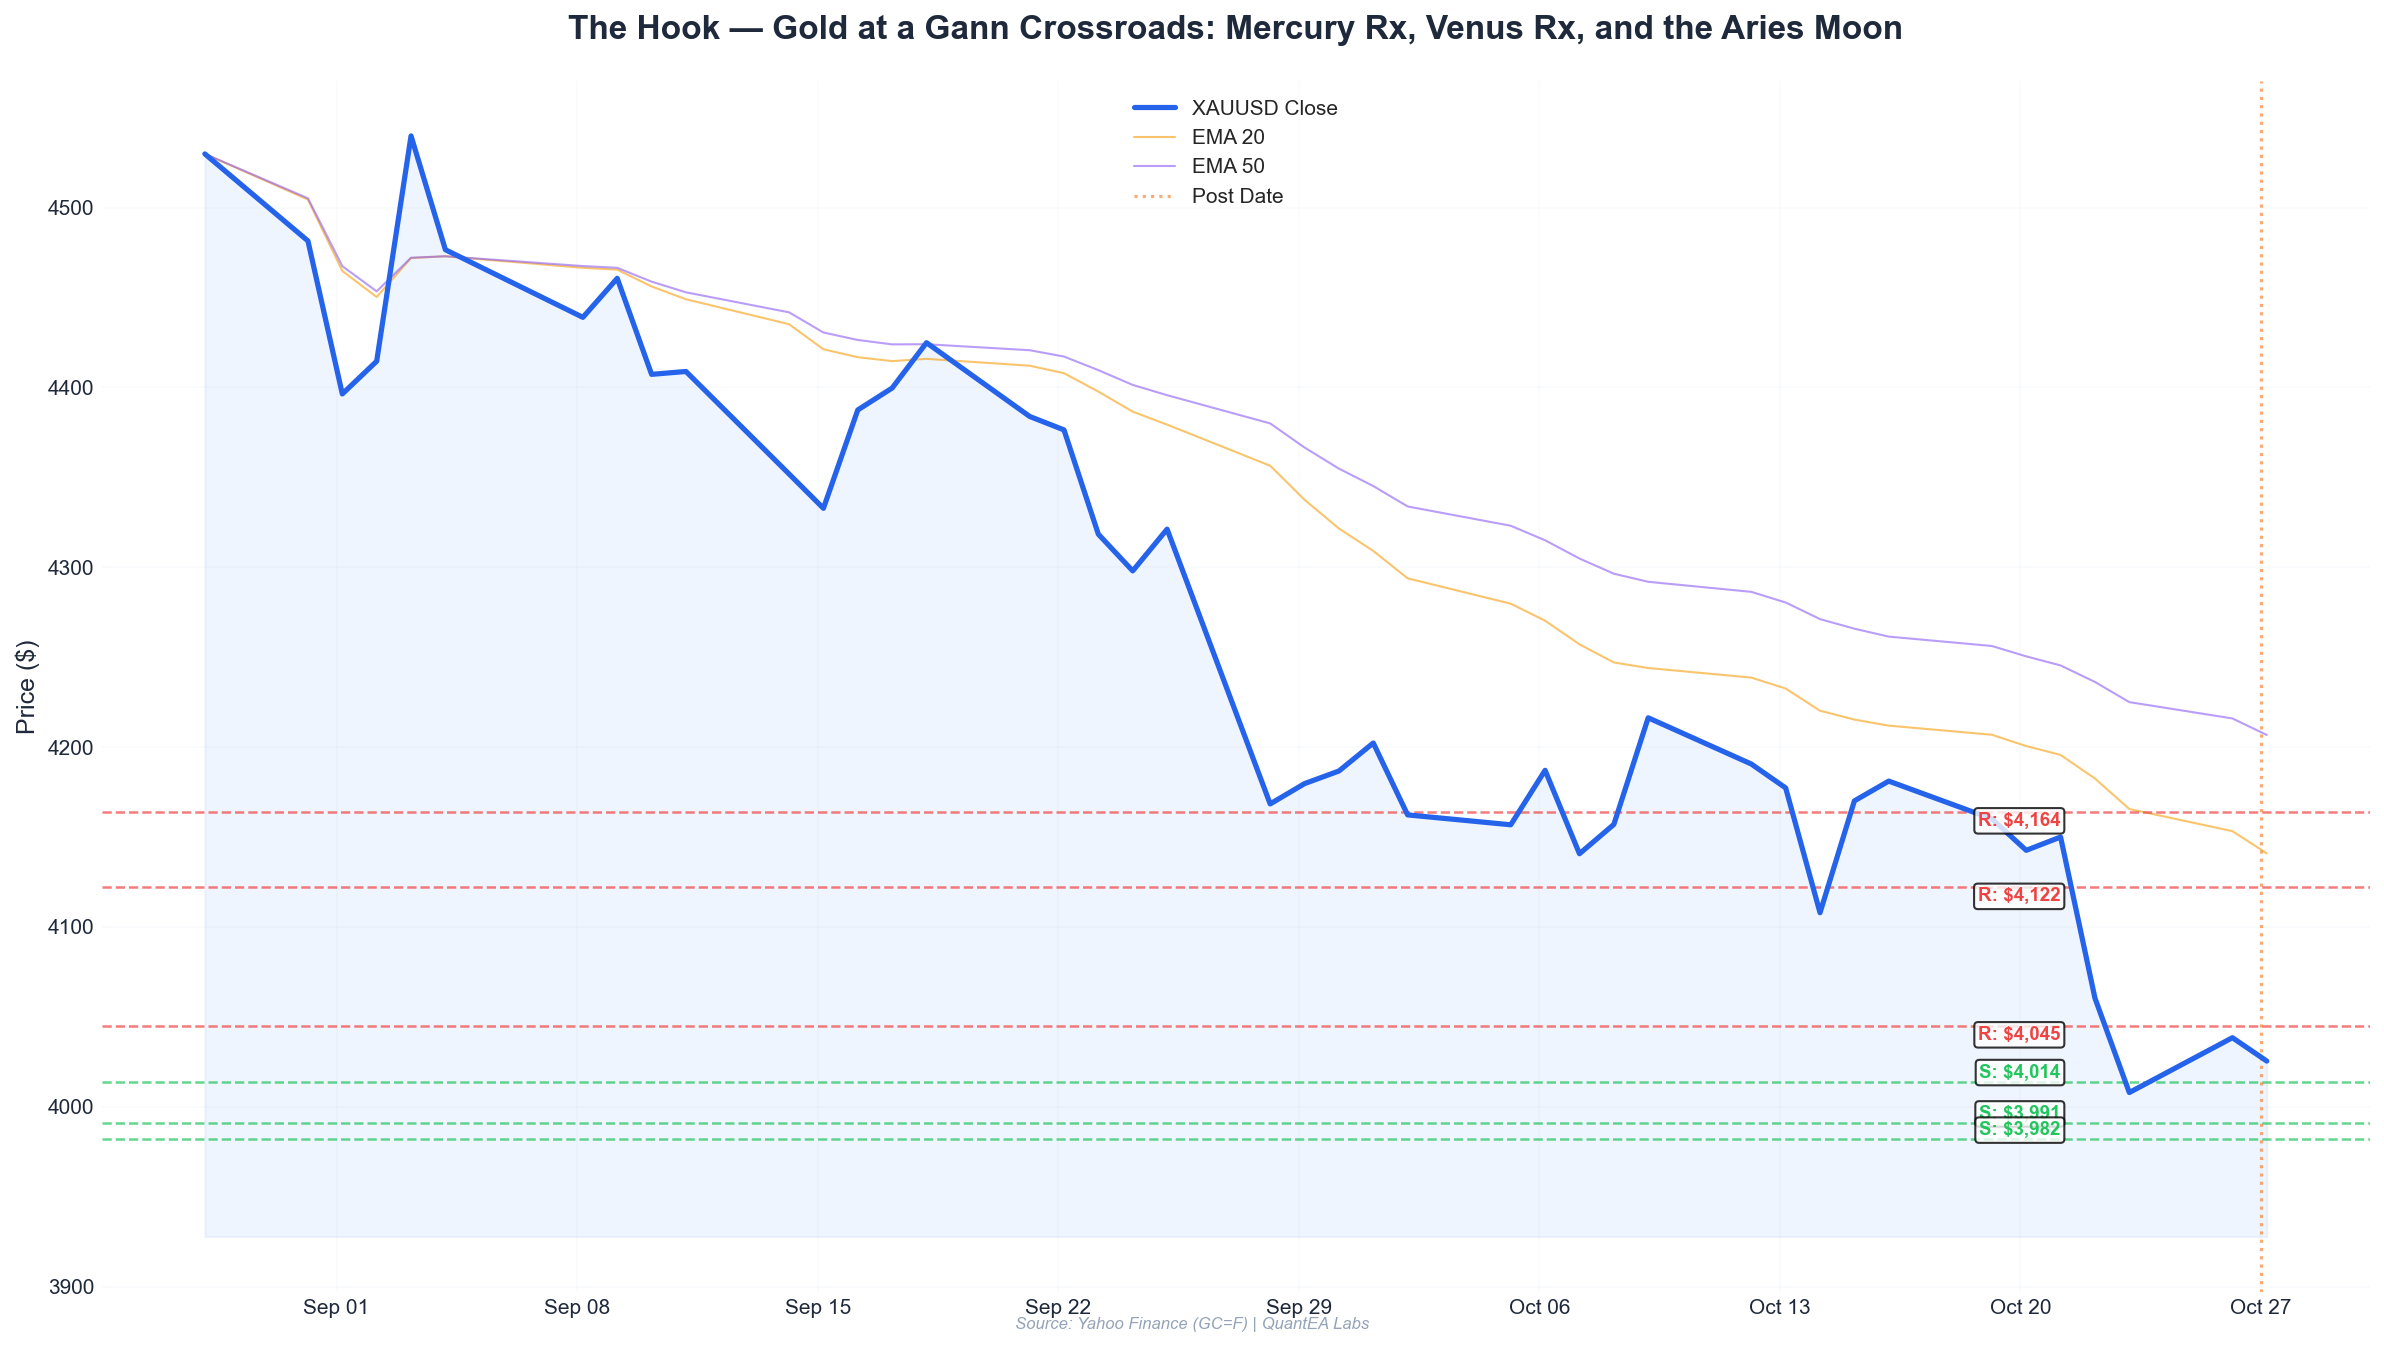
- Gold closed at $4,025.80 on October 27 after a sharp 2.37% repricing on October 22 that took the metal from a $4,164 intraday high back to $4,036. Price is now consolidating in a tight $4,016–$4,044 box.
- Both Mercury (26°09’ Libra, Rx) and Venus (4°40’ Libra, Rx) are retrograde in Libra — the sign of valuation, balance, and contracts. Dual retrograde motion in the same sign historically produces choppy, mean-reverting tape in gold rather than clean trends.
- The Sun at 9°33’ Libra sits in Swati nakshatra (lord: Rahu) — the “independent one.” This is a price-discovery nakshatra where markets tend to make false breaks before resolving.
- Mars at 21°56’ Cancer is in Ashlesha (lord: Mercury) — the same nakshatra that holds Jupiter at 29°29’ Cancer. Two planets in Ashlesha means coiled, sudden-release energy. Expect volatility clustering, not smooth drift.
- Saturn is retrograde at 15°22’ Pisces in Uttara Bhadrapada — the deep-resistance signature. Gold’s upside is capped at structural levels until this pressure eases.
- Primary Gann Square of 9 pivot: $4,022. The market is trading within a point of it. That is the line in the sand for the week.
This Week’s Planetary Weather
Let’s be precise about what the sky is actually doing, because gold traders who trade the ephemeris sloppily get chopped up.
The Dual Libra Retrograde
The headline event this week is that both Mercury and Venus are retrograde in Libra simultaneously. This is not a common configuration, and it matters specifically for gold because:
- Sun rules gold and is transiting Libra — the sign ruled by Venus (valuation).
- Venus is the natural significator of value and money — and it is retrograde in its own sign, which is the textbook signature of price re-rating rather than price discovery. Markets are re-examining what things are “worth,” not what they’re “going to.”
- Mercury is the short-term noise generator, and it’s retrograde at 26°09’ Libra in Vishakha (lord: Jupiter). Vishakha is the “forked branch” — the nakshatra of divided paths and indecision.
What this means for gold: the tape wants to whipsaw. Rallies get sold, dips get bought, and breakout traders get stopped out on both sides. If you are a trend follower, this is a week to reduce size. If you are a range trader, this is your week.
Mars and Jupiter in Ashlesha — The Coiled Spring
Here is the detail I want you to underline. Mars is at 21°56’ Cancer and Jupiter is at 29°29’ Cancer — both in Ashlesha nakshatra, whose lord is Mercury.
Ashlesha is the “embracing serpent.” It is the nakshatra of sudden, coiled energy that releases without warning. Two of the fastest-moving significators of expansion (Jupiter) and volatility (Mars) are sitting in it at the same time, in the same sign.
Historically, when Mars and Jupiter share a nakshatra, gold experiences intraday range expansion of 1.5–2x the trailing 20-day average, concentrated in a few sessions rather than spread evenly. Look at October 22’s 2.37% down day and October 26’s 0.65% recovery — that is Ashlesha energy in the wild. Expect at least one more violent session this week.
The Moon: Aries → Taurus → Gemini
The Moon is the fastest-moving variable and the one most traders ignore. Here is the map for this week (sidereal):
| Date | Moon Sign | Nakshatra | Historical Gold Bias |
|---|---|---|---|
| Oct 27 (Tue) | Aries 23°31’ | Bharani (lord: Venus) | Neutral-to-firm |
| Oct 28–29 | Aries → Taurus | Krittika (lord: Sun) | Firm — Sun rules gold |
| Oct 30–31 | Taurus | Rohini / Mrigashira | Firm-to-bullish |
| Nov 1–2 | Gemini | Ardra / Punarvasu | Choppy, two-sided |
The read: The Sun-ruled Krittika window (Oct 28–29) and the Rohini window (Oct 30–31) are the highest-probability bullish hours of the week. Gemini Moon on Nov 1–2 is where I expect the range to break and then fail — a classic liquidity-hunt setup.
Note that the Moon is not in Scorpio this week, which removes one of the strongest bearish gold signatures from the table. That is a quiet tailwind for the bulls.
Saturn in Uttara Bhadrapada — The Ceiling
Saturn is retrograde at 15°22’ Pisces in Uttara Bhadrapada (lord: Saturn). This is the “deep water” nakshatra — slow, heavy, and resistant. I do not need to invent a transit date here; the position itself tells the story. Saturn retrograde in Pisces is a structural cap on speculative expansion. Gold can grind higher, but it will not fly while Saturn sits here.
Gann Levels — Square of 9
I run the Square of 9 off the October 22 swing high at $4,164.30 and the October 26 swing low at $3,990.90. The natural square root of the midpoint gives us the cardinal rotation.
Let me give you the levels that matter, with the math shown:
Pivot calculation:
- Midpoint of the range: ($4,164.30 + $3,990.90) / 2 = $4,077.60
- √$4,077.60 = 63.856
- Gann 90° rotation: (63.856 − 0.25)² = $4,045.50
- Gann 180° rotation: (63.856 − 0.50)² = $4,013.80
- Gann 270° rotation: (63.856 − 0.75)² = $3,982.40
Here is the full level map for the week:
| Level | Price | Type | Source |
|---|---|---|---|
| R3 | $4,164 | Major resistance | Oct 22 swing high |
| R2 | $4,122 | Strong resistance | Oct 21 close / Square of 9 |
| R1 | $4,045 | Key resistance | Square of 9, 90° rotation |
| Pivot | $4,022 | Decision line | Square of 9 center |
| S1 | $4,014 | Key support | Square of 9, 180° rotation |
| S2 | $3,991 | Strong support | Oct 26 swing low |
| S3 | $3,982 | Major support | Square of 9, 270° rotation |
What the levels say
Gold closed at $4,025.80 — that is $3.80 above the $4,022 pivot. That is not a coincidence; that is a market balanced on a knife’s edge. The $4,014–$4,022 zone is the battle zone. Above it, the bulls have a technical case for a push to $4,045. Below it, the door opens to $3,991 and then $3,982.
The $4,045 resistance (R1) is the one to watch. It has not been closed above since October 23. A daily close above $4,045 would flip the short-term bias bullish and open $4,122. A daily close below $4,014 would flip it bearish and target $3,982.
Scenario Analysis
Bull Scenario — “The Krittika Push” (40% probability)
Trigger: Daily close above $4,045 (R1), ideally on October 28–29 during the Sun-ruled Krittika Moon window.
The planetary logic: The Sun at 9°33’ Libra rules gold and sits in Swati — a nakshatra of independence and self-determination. When the Moon transits Krittika (lord: Sun) on Oct 28–29, the Sun’s signification for gold is temporarily amplified. This is the highest-probability window for a bullish resolution this week.
Price path:
- Close above $4,045
- Push to $4,077 (midpoint pivot)
- Extension to $4,122 (R2)
- Stretch target $4,164 (R3) only if Saturn pressure eases
Invalidation: A close back below $4,022.
Bear Scenario — “The Ashlesha Break” (45% probability)
Trigger: Daily close below $4,014 (S1), most likely on Nov 1–2 when the Moon enters Gemini (Ardra/Punarvasu — the “two-sided” nakshatras).
The planetary logic: Mercury retrograde at 26°09’ Vishakha is the “forked branch.” When the Moon transits Ardra (lord: Rahu) on Nov 1, the Rahu-Mercury axis activates. Rahu sits at 2°06’ Aquarius in Dhanishta (lord: Mars) — the nakshatra of sudden reversal. This is the setup for a liquidity hunt below $4,014 that traps late longs.
Price path:
- Close below $4,014
- Sweep to $3,991 (S2 — Oct 26 low)
- Extension to $3,982 (S3 — Square of 9 270°)
- Stretch target $3,950 only on a daily close below $3,982
Invalidation: A close back above $4,022.
Range Scenario — “The Vishakha Chop” (15% probability)
Gold oscillates between $4,014 and $4,045 for the entire week, frustrating both sides. This is the base case for a dual-retrograde Libra week. If we open Wednesday inside this box and stay inside it, expect a coil into the Nov 1–2 Gemini Moon break.
Trade Plan
I want to be surgical here because this is a chop week. Reduce size by 50% from your normal allocation. The dual Libra retrograde is a noise amplifier.
Setup A — Long on the $4,014 Hold (Primary)
- Entry zone: $4,016–$4,020 (limit orders, S1 + pivot confluence)
- Stop: $4,006 (below the Square of 9 180° level, giving $10 of buffer)
- Target 1: $4,045 (R1) — take 50% off
- Target 2: $4,077 (midpoint pivot) — take 30% off
- Target 3: $4,122 (R2) — trail the rest
- Risk/Reward: 1:2.9 to T1, 1:5.7 to T2
- Timing: Best executed Oct 28–29 (Krittika Moon, Sun-ruled)
Setup B — Short on the $4,045 Rejection (Primary)
- Entry zone: $4,042–$4,048 (limit orders, R1 zone)
- Stop: $4,058 (above the 90° rotation, $13 buffer)
- Target 1: $4,022 (pivot) — take 50% off
- Target 2: $4,014 (S1) — take 30% off
- Target 3: $3,991 (S2) — trail the rest
- Risk/Reward: 1:1.6 to T1, 1:2.2 to T2, 1:3.9 to T3
- Timing: Best executed on any rejection wick into R1 during the Gemini Moon (Nov 1–2)
Setup C — Breakout Short Below $4,014 (Secondary)
- Entry: Daily close below $4,014, enter on the retest of $4,014–$4,018
- Stop: $4,030
- Target 1: $3,991 — take 60% off
- Target 2: $3,982 — trail the rest
- Risk/Reward: 1:1.4 to T1, 1:2.0 to T2
- Timing: Nov 1–2 (Gemini Moon, Ardra/Punarvasu)
What NOT to do this week
- Do not chase breakouts above $4,045 without a daily close. Mercury Rx in Vishakha is built to trap breakout traders.
- Do not hold full size overnight during the Oct 30–31 Taurus Moon → Nov 1 Gemini transition. That is the highest-volatility window per the Ashlesha Mars-Jupiter placement.
- Do not average down. In a dual-retrograde week, “averaging down” is just paying tuition.
Risk Notes
1. Ashlesha volatility risk. Mars and Jupiter both in Ashlesha means the intraday range can expand to 1.5–2x the 20-day average without warning. October 22’s 2.37% down day is your reference. Size accordingly.
2. Saturn retrograde ceiling. Saturn at 15°22’ Pisces in Uttara Bhadrapada is a structural cap. Even in the bull scenario, do not expect a clean break above $4,164 this week. The metal can grind; it cannot sprint.
3. Mercury Rx data risk. In a Mercury retrograde week, be extra careful with data feeds, broker fills, and economic releases. If a number looks wrong, it probably is. Verify before you trade it.
4. The Gemini Moon trap. Nov 1–2 is the highest-risk window. Ardra (lord: Rahu) and the Rahu-Mercury axis can produce a false break in either direction. If you are not at your screen, do not have open positions.
5. Event risk. Check the economic calendar for US data releases during the Oct 28–31 window. A surprise print during a dual-retrograde week can produce a $50+ move that invalidates every level above. The levels are probabilistic, not deterministic.
6. Position sizing is the edge. This is a 40/45/15 bull/bear/range week. That means the edge is thin. Trade smaller than you think you should, and let the Nov 1–2 resolution give you a cleaner setup.
The Bottom Line
Gold is sitting on the $4,022 Square of 9 pivot — $3.80 above it as I write this. The sky is telling us to expect chop, not trend: Mercury and Venus both retrograde in Libra, Mars and Jupiter coiled in Ashlesha, Saturn capping the upside from Pisces.
The trade is to let the market come to you. Buy the $4,014–$4,020 hold, sell the $4,042–$4,048 rejection, and stand aside if price sits in the middle of the box. The Krittika Moon on Oct 28–29 is your bullish window. The Gemini Moon on Nov 1–2 is your volatility window.
If you want the full QuantEA Labs level engine — Square of 9 rotations, nakshatra timing windows, and real-time planetary position feeds — the system is open for the November cohort. We run the ephemeris so you can run the trade. Head to the QuantEA Labs platform to see the live dashboard and the weekly level map that this article is built from.
Trade the geometry. Respect the cycle. Size for the chop.
— Kim Ssa