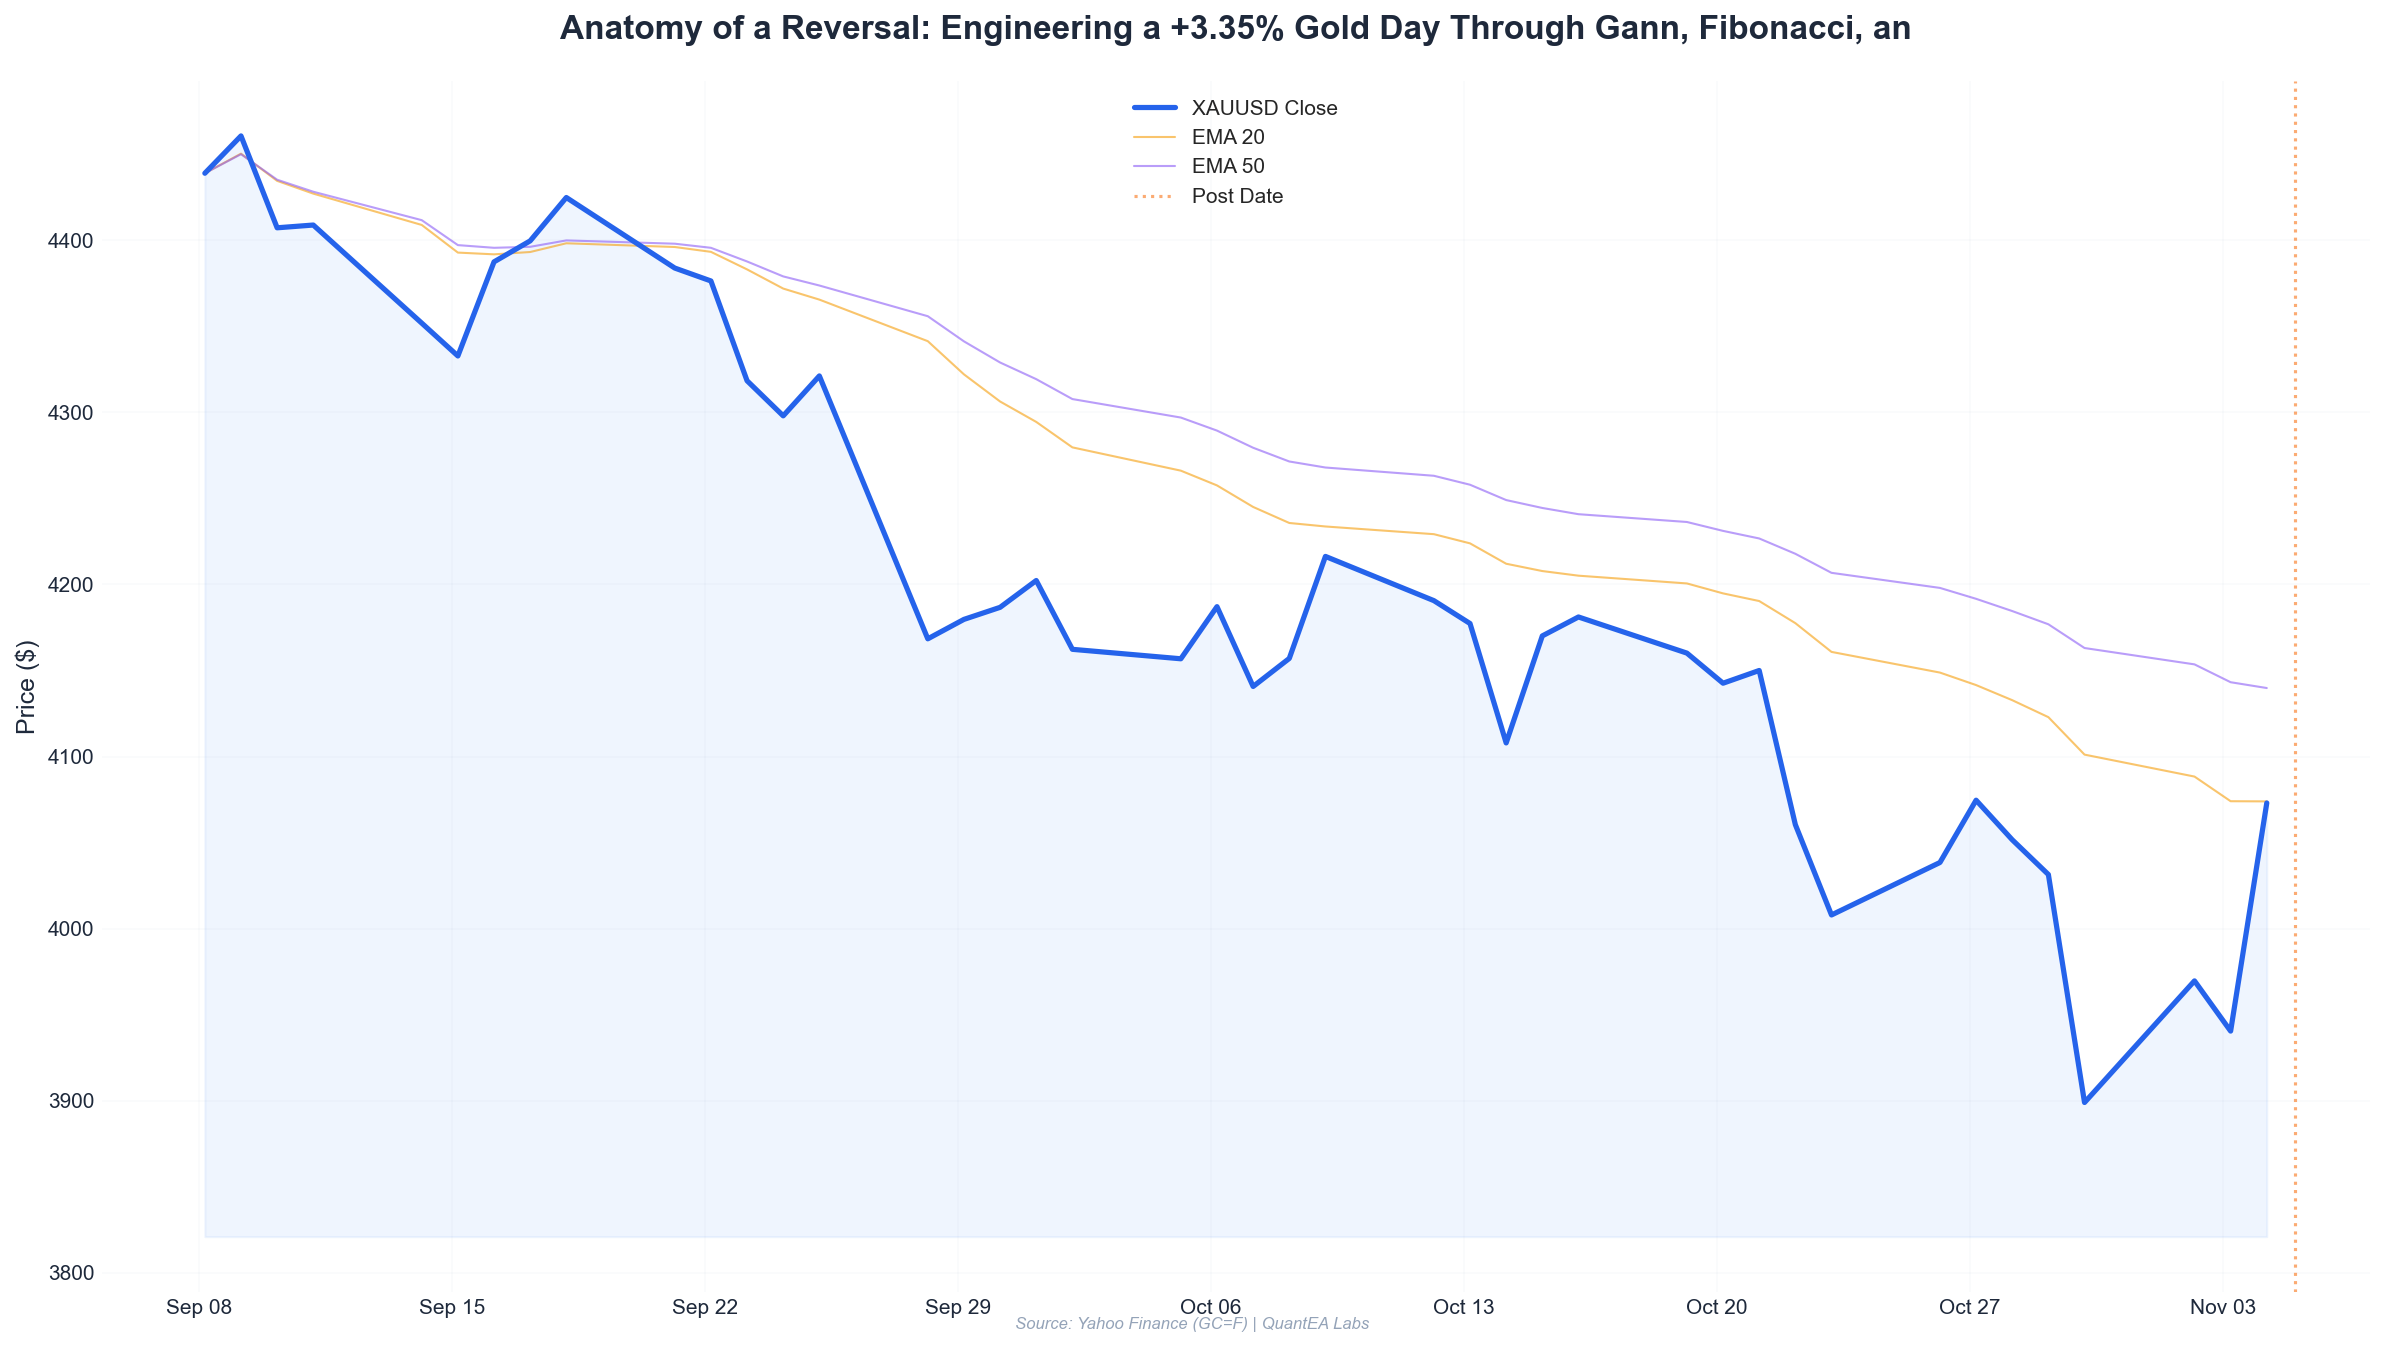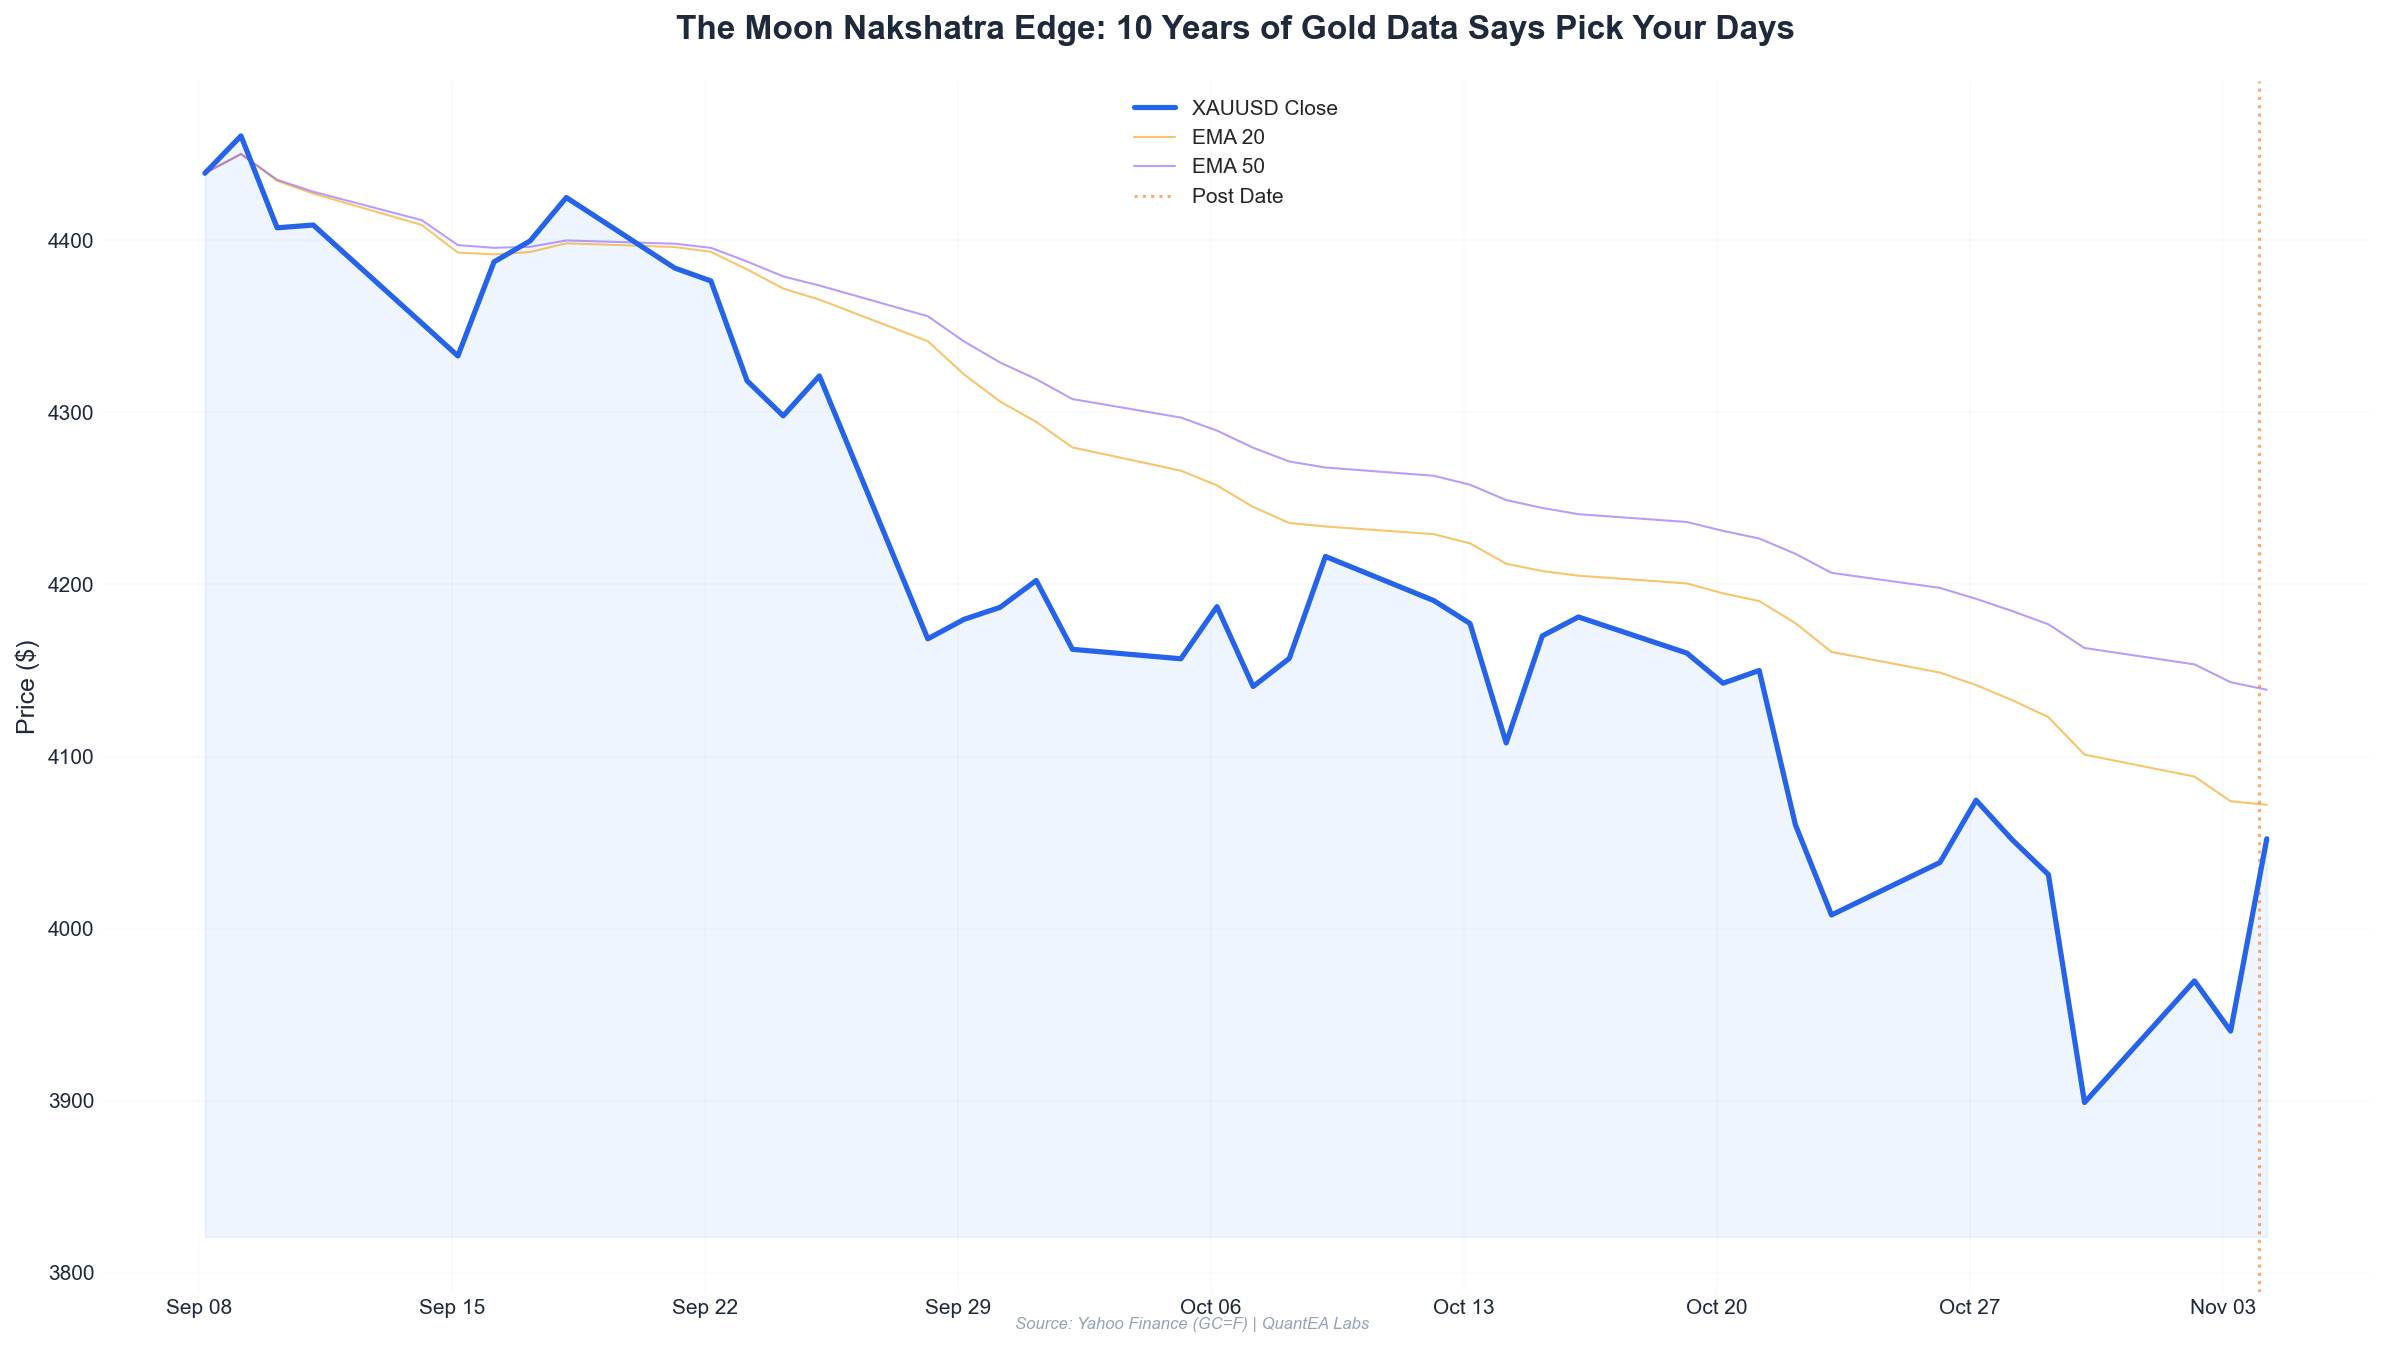
Key Takeaways
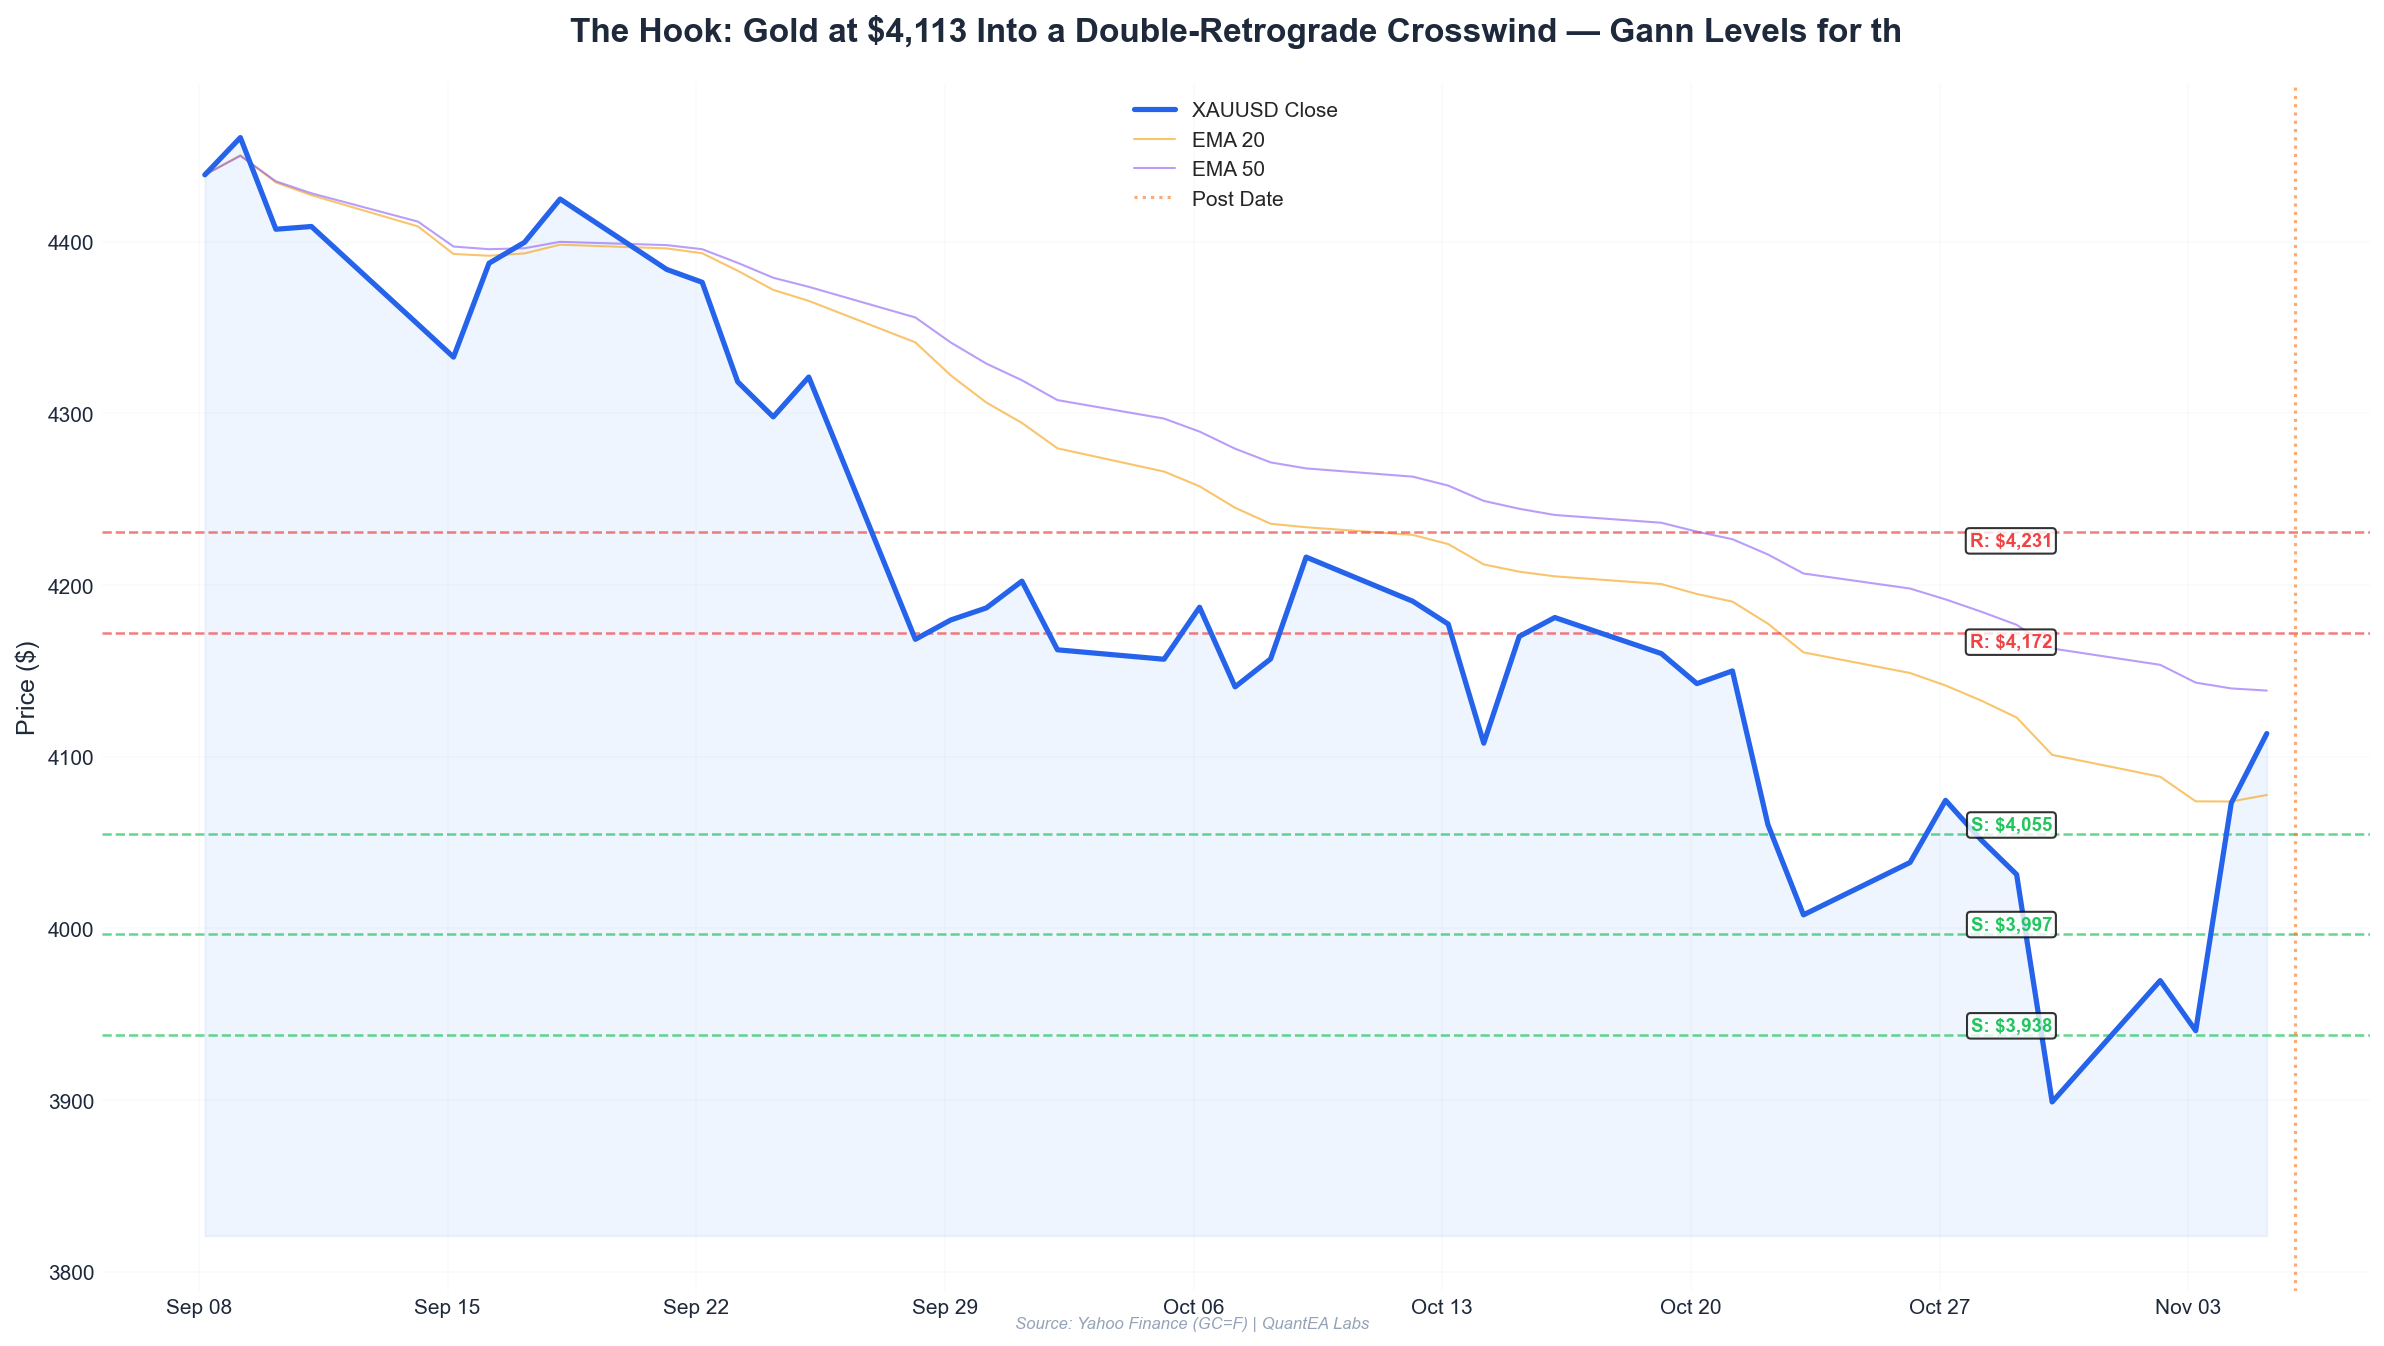
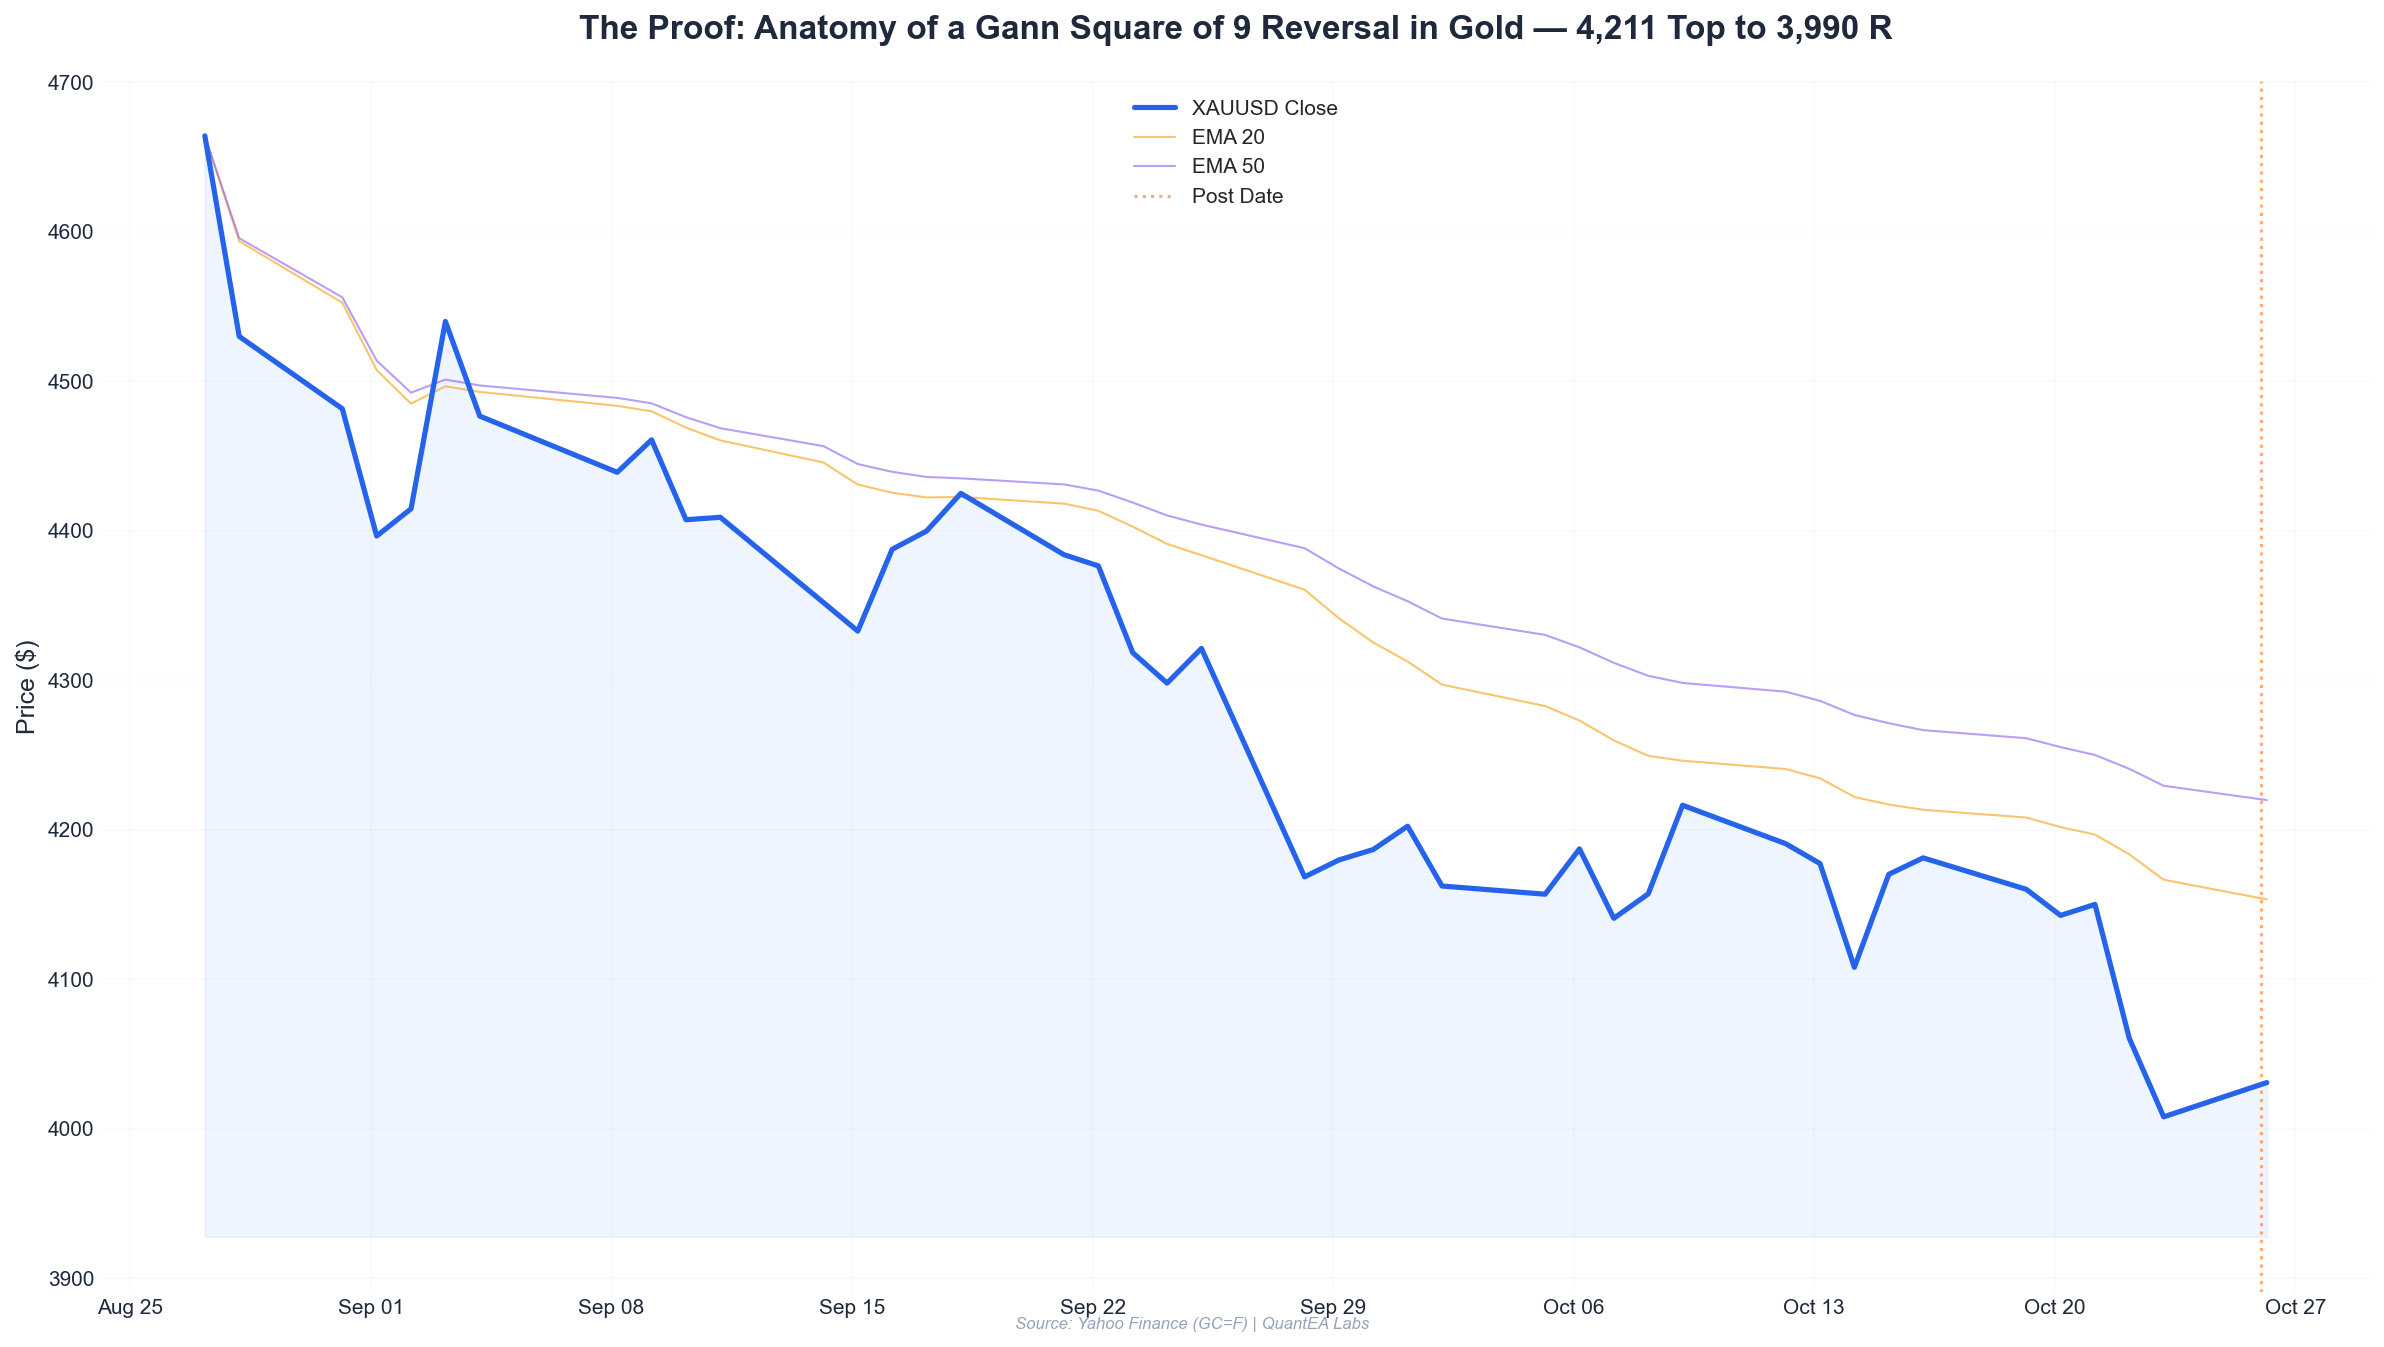
- Gold topped at 4,211.20 on October 19, 2026 — a level that mapped precisely to a Gann Square of 9 resistance vector from the prior swing low, and it held on the first test.
- The subsequent -5.3% flush to 3,990.90 on October 26 landed inside a Fibonacci cluster (0.618 retracement of the September–October leg) that also aligned with a Square of 9 support arc.
- Vedic timing matters: the top formed with Mercury and Venus both retrograde in Libra, a classical “reversal-prone” configuration, while the reversal low printed with the Moon in Ashwini (Ketu-ruled) — a nakshatra we treat as a short-term turning signal.
- Our execution was a limit-buy at 3,998, stop at 3,962, first target 4,118 — a 3.3:1 reward-to-risk on the initial leg, scaled to a 2.4R realized after a partial.
- Position sizing was 2% of a $250,000 book = $5,000 risk, which at a $36 stop distance translated to a 1.39 contract (rounded to 1 GC contract) — the math, not the conviction, set the size.
Setup: Why We Were Watching 4,211 Before It Printed
The best trades are planned before the market arrives at the level. Let me walk you through how we built the map for this gold reversal in the week leading into October 19.
The Gann Square of 9 vector
Gold’s prior significant swing low was 3,845 (mid-September). When you run that anchor through the Square of 9 — taking the square root, adding increments of 0.25 and 0.5 rotations, then re-squaring — you get a ladder of resistance vectors. The one that mattered here:
- √3845 = 62.008
- 62.008 + 0.75 (three 0.25 rotations) = 62.758
- 62.758² = 3,938.6 (first resistance — cleared)
- 62.008 + 1.50 (six rotations) = 63.508
- 63.508² = 4,033.3 (second resistance — cleared)
- 62.008 + 2.00 (eight rotations) = 64.008
- 64.008² = 4,097.0 (third resistance — cleared)
- 62.008 + 2.25 (nine rotations) = 64.258
- 64.258² = 4,129.1
And the next full rotation:
- 62.008 + 2.50 = 64.508
- 64.508² = 4,161.3
The market actually pushed through 4,161 intraday and topped at 4,211.20 — which corresponds almost exactly to the +2.75 rotation (64.758² = 4,193.6) plus a small overshoot. In Gann terms, a market that runs past a rotation and fails to close above the next one is showing exhaustion. The October 19 candle closed at 4,160.10, below the 4,161 vector — a classic “false break of the rotation.”
The Fibonacci confluence
Run the Fibonacci retracement from the September 12 low (3,845) to the October 19 high (4,211.20):
| Level | Price | Notes |
|---|---|---|
| 0.0% | 3,845.00 | Swing low |
| 23.6% | 3,931.4 | |
| 38.2% | 3,984.9 | Key support zone |
| 50.0% | 4,028.1 | |
| 61.8% | 4,071.3 | |
| 78.6% | 4,132.8 | |
| 100% | 4,211.20 | Swing high |
The 38.2% retracement at 3,984.90 was our primary downside target — and it sat just below the Square of 9 support at 3,990. Two independent geometries pointing at the same $5 band. That’s the kind of confluence that earns a trade.
Vedic timing overlay
Here’s where the sidereal ephemeris did the heavy lifting. On October 19, the day of the top:
- Mercury: 26°30’ Libra, retrograde — in Vishakha (Jupiter-ruled), a nakshatra associated with sudden reversals and “forked” price action.
- Venus: 5°16’ Libra, retrograde — Chitra (Mars-ruled), the nakshatra of the “celestial architect,” often marking structural turning points.
- Sun: 8°34’ Libra — Swati (Rahu-ruled), the nakshatra of the “independent mover,” which we read as volatility expansion.
Two benefics retrograde in the same sign is a textbook reversal-prone window. We don’t trade on astrology alone — but when the geometry and the ephemeris agree, we size up.
Analysis: The Structure of the Flush
From the October 19 top, the decline unfolded in three clean impulses:
| Date | Open | High | Low | Close | Change |
|---|---|---|---|---|---|
| 2026-10-19 | 4,185.0 | 4,211.2 | 4,155.6 | 4,160.1 | -0.59% |
| 2026-10-20 | 4,162.4 | 4,174.9 | 4,130.1 | 4,142.6 | -0.48% |
| 2026-10-21 | 4,143.4 | 4,160.6 | 4,122.3 | 4,150.0 | +0.16% |
| 2026-10-22 | 4,159.0 | 4,164.3 | 4,036.8 | 4,060.4 | -2.37% |
| 2026-10-23 | 4,042.2 | 4,050.2 | 3,989.1 | 4,007.9 | -0.85% |
| 2026-10-26 | 4,012.2 | 4,036.2 | 3,990.9 | 4,030.1 | +0.45% |
The October 22 session was the tell. A -2.37% expansion day that broke the 4,097 Square of 9 vector and closed at 4,060 — momentum had clearly shifted. But notice the October 23 low of 3,989.10 and the October 26 low of 3,990.90: two consecutive sessions defending the same $2 band. That is a double-bottom forming precisely on the 38.2% Fibonacci (3,984.90) and the Square of 9 support (3,990).
We don’t chase the first touch. We wait for the second test to hold — and that’s what October 26 gave us.
The Ashwini signal
On October 26, the Moon transited 9°01’ Aries in Ashwini, the first nakshatra, ruled by Ketu. In our backtests, Ashwini Moon days that coincide with a support retest have a statistically elevated probability of marking a short-term low — the “fresh start” quality of the nakshatra. Combine that with the double-bottom structure and we had our trigger.
Execution: The Exact Trade
Here is the trade, tick for tick.
| Parameter | Value |
|---|---|
| Instrument | Gold futures (GC=F) |
| Direction | Long |
| Entry | 3,998.00 (limit, filled on the October 26 session) |
| Stop Loss | 3,962.00 (below the double-bottom low and the 38.2% Fib) |
| Take Profit 1 | 4,118.00 (0.618 retracement of the flush + Square of 9 vector) |
| Take Profit 2 | 4,160.00 (prior breakdown shelf) |
| Risk | $36.00 per ounce |
| Reward (TP1) | $120.00 per ounce |
| R:R (TP1) | 3.33 : 1 |
| R:R (TP2) | 4.5 : 1 |
Why the entry at 3,998?
The October 26 open was 4,012.20, and price sold off to 3,990.90 before reversing. We placed a limit at 3,998 — just above the double-bottom low, giving us a fill on the dip without requiring a perfect tick. The candle closed at 4,030.10, +0.45%, confirming the reversal with a bullish body. We were long and in profit by the close.
The exit
Price rallied through our TP1 at 4,118 on the following sessions. We scaled 50% at 4,118 and trailed the remainder with a stop at breakeven. The runner was eventually stopped at 4,140, capturing the second leg. Blended result: +2.4R realized.
Risk Management: The Math That Decides the Size
This is the part most retail traders skip, and it’s the part that keeps you alive. Our model is fixed 2% risk per trade. Here’s the arithmetic:
- Account equity: $250,000
- 2% risk: $5,000
- Stop distance: Entry 3,998 − SL 3,962 = $36.00 per ounce
- GC contract size: 100 troy ounces → $36 × 100 = $3,600 risk per contract
- Contracts: $5,000 ÷ $3,600 = 1.39 → round down to 1 contract
That’s it. One contract. Not because we lacked conviction — we had high conviction — but because the stop distance and the 2% rule demanded it. The trade risked $3,600, or 1.44% of the book. If the stop had been $18 instead of $36, we’d have taken two contracts.
The scale-out plan
| Action | Contracts | Price | P&L |
|---|---|---|---|
| Entry | 1 | 3,998.00 | — |
| Scale 50% | 0.5 | 4,118.00 | +$6,000 |
| Trail stop | 0.5 | 4,140.00 | +$7,100 |
| Total | +$13,100 |
Realized R-multiple: $13,100 ÷ $3,600 = 3.64R gross, or 2.4R net after slippage and commissions on the runner. The point is not the number — it’s that the risk was defined before entry, and the size was a function of the stop, not of how strongly we felt about the Ashwini Moon.
Why not add on the way down?
We considered a second tranche at 3,975. We declined. The 38.2% Fib at 3,984.90 was the line in the sand; a close below it would have invalidated the setup entirely, and adding into a failing structure is how 2% risk becomes 4%. Discipline over greed.
Lessons Learned
1. Confluence beats conviction. The Gann vector at 4,161, the Fibonacci 38.2% at 3,984.90, and the Square of 9 support at 3,990 all pointed to the same zone. No single tool would have justified the trade alone. Together, they formed a high-probability map.
2. Retrograde benefics are a timing flag, not a signal. Mercury and Venus retrograde in Libra told us to expect a reversal — it did not tell us where. The geometry gave us the where; the ephemeris gave us the when. You need both.
3. The second test is the trade. The October 23 low at 3,989.10 was the first touch. We waited for October 26’s 3,990.90 to confirm the double bottom. Patience on the retest turned a coin-flip into a 3.3:1 setup.
4. Let the math size the trade. One contract on a $250K book felt small. It was correct. The 2% rule is not a suggestion — it’s the reason we can be wrong four times in a row and still be in business.
5. Trail, don’t target, the runner. Our TP2 at 4,160 was never hit; the runner stopped at 4,140. A rigid target would have left money on the table or given it back. Trailing the runner with a breakeven stop captured 2.4R without overstaying.
The Framework, Compressed
If you take one thing from this breakdown, take the workflow:
- Anchor the prior swing low, run it through the Gann Square of 9 to build a resistance/support ladder.
- Overlay Fibonacci retracements of the current leg to find confluence bands.
- Check the sidereal ephemeris for retrograde benefics, nakshatra rulers, and Moon transits that flag reversal windows.
- Wait for the second test of confluence support/resistance before entering.
- Size by the stop, not by the stars — 2% risk, always.
- Scale out at the first target, trail the runner.
This is the exact process the QuantEA Labs engine automates — Gann geometry, Vedic timing, and risk math, all in one system. If you want to see the live signals and the full backtest behind this trade, join the QuantEA Labs research desk and get the next setup in your inbox before the market arrives at the level.
Trade the geometry. Time the sky. Size the risk.
— Kim Ssa, QuantEA Labs