Key Takeaways
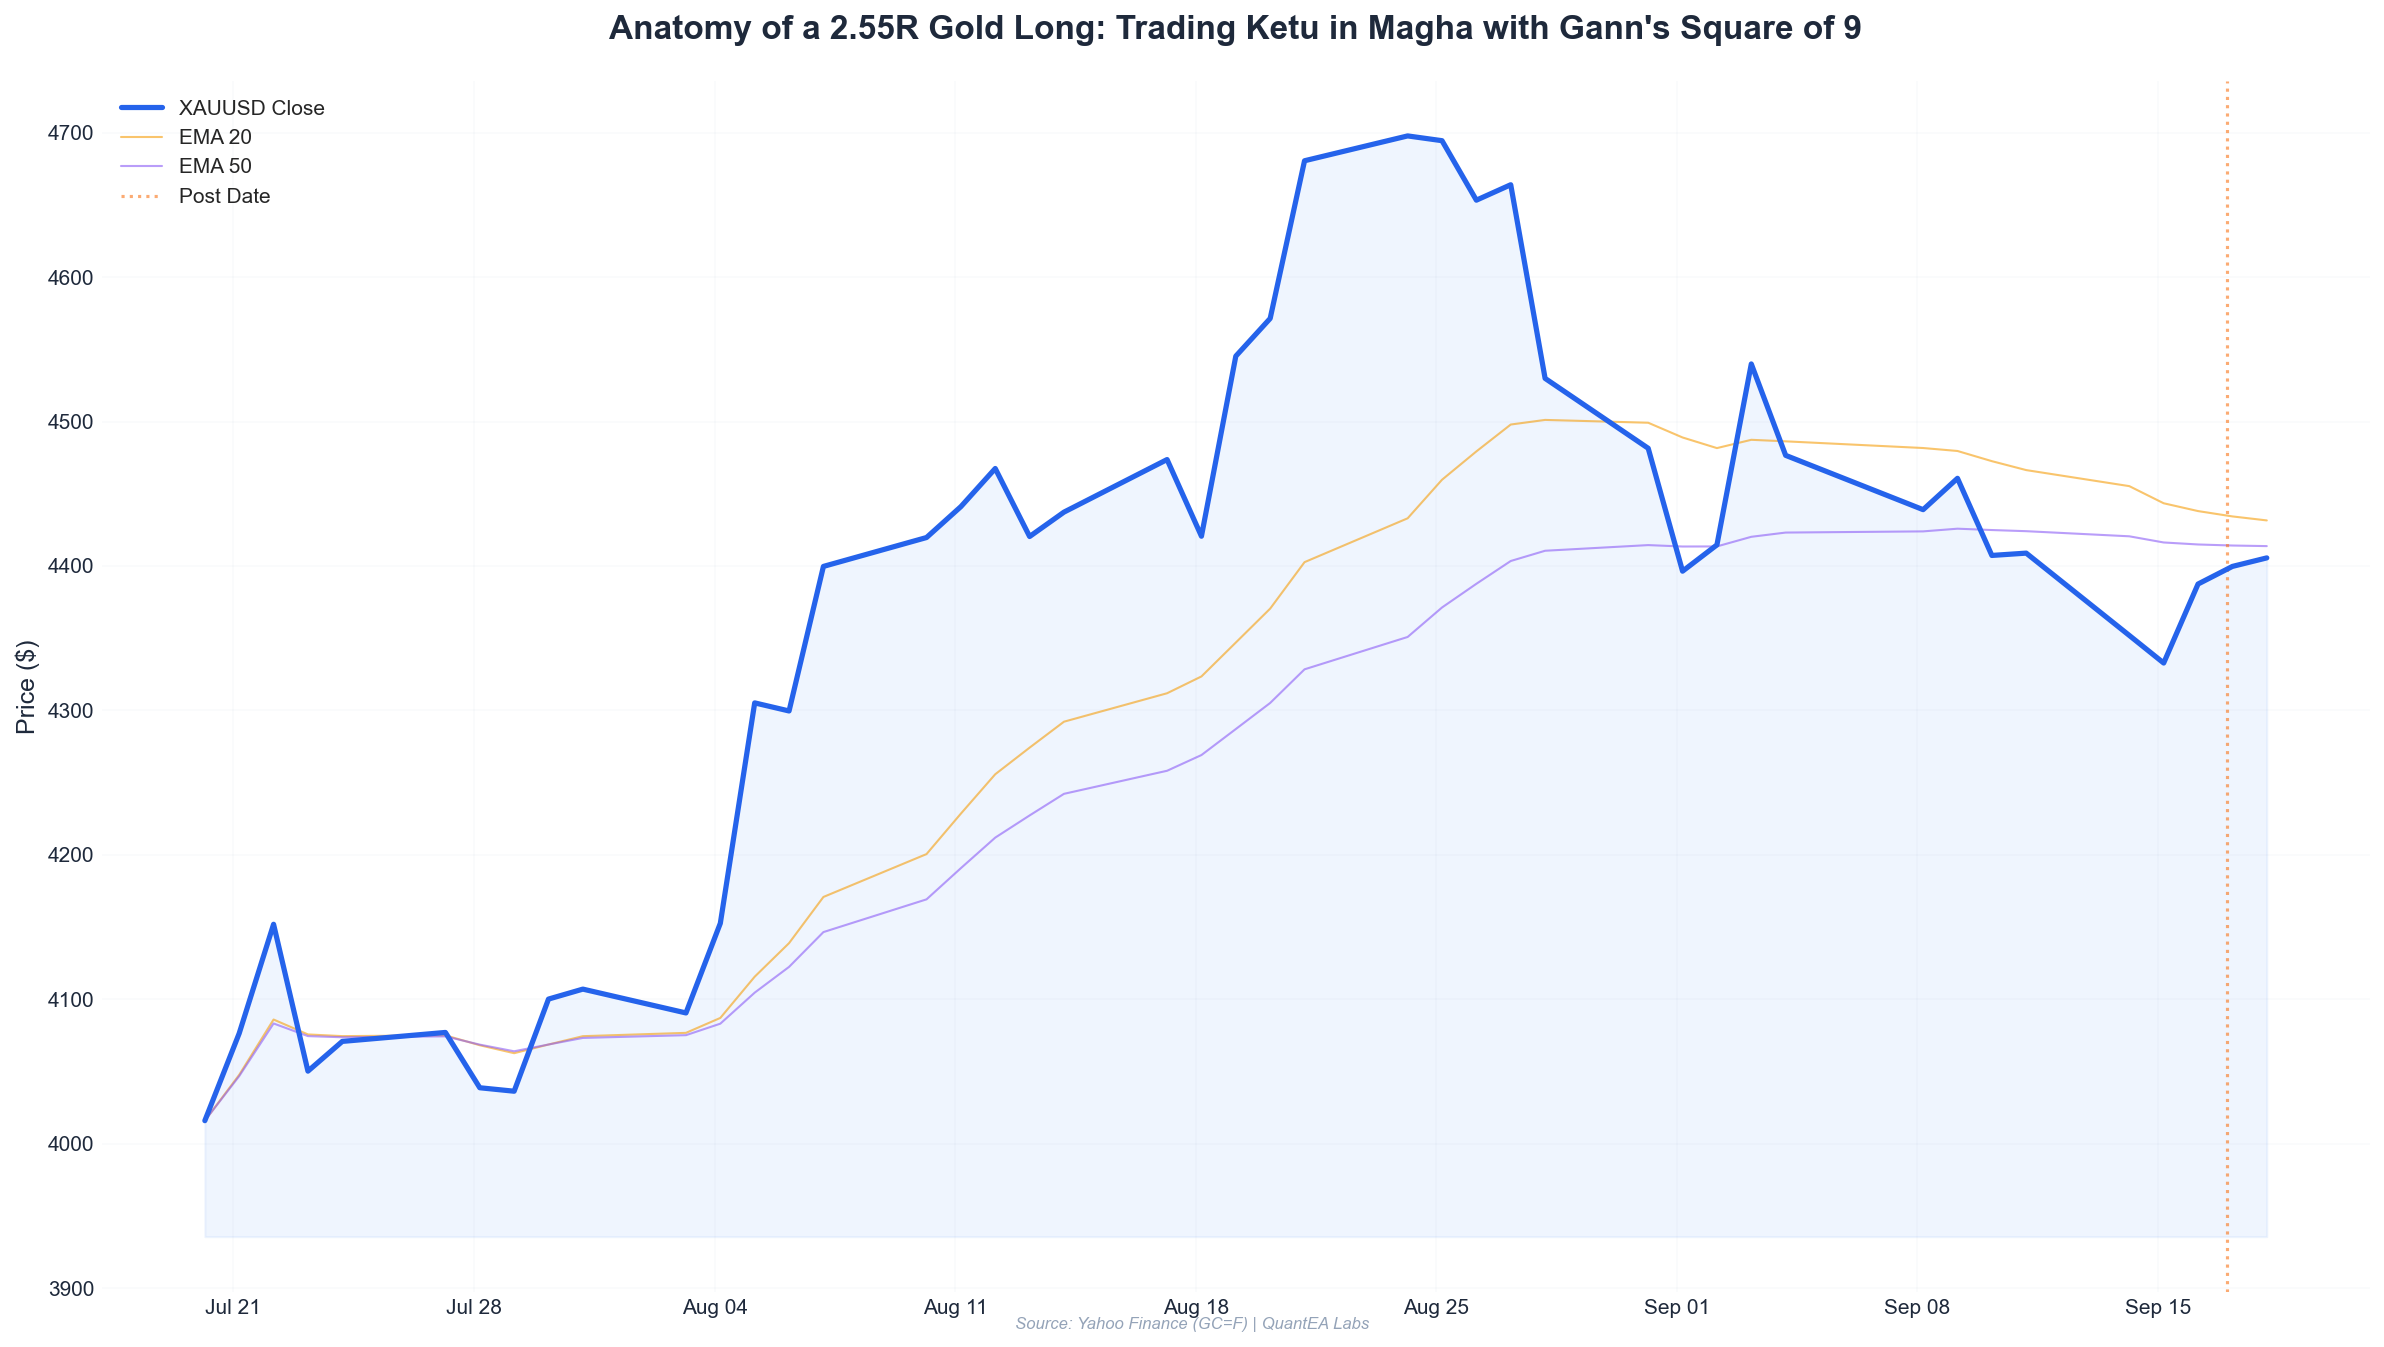
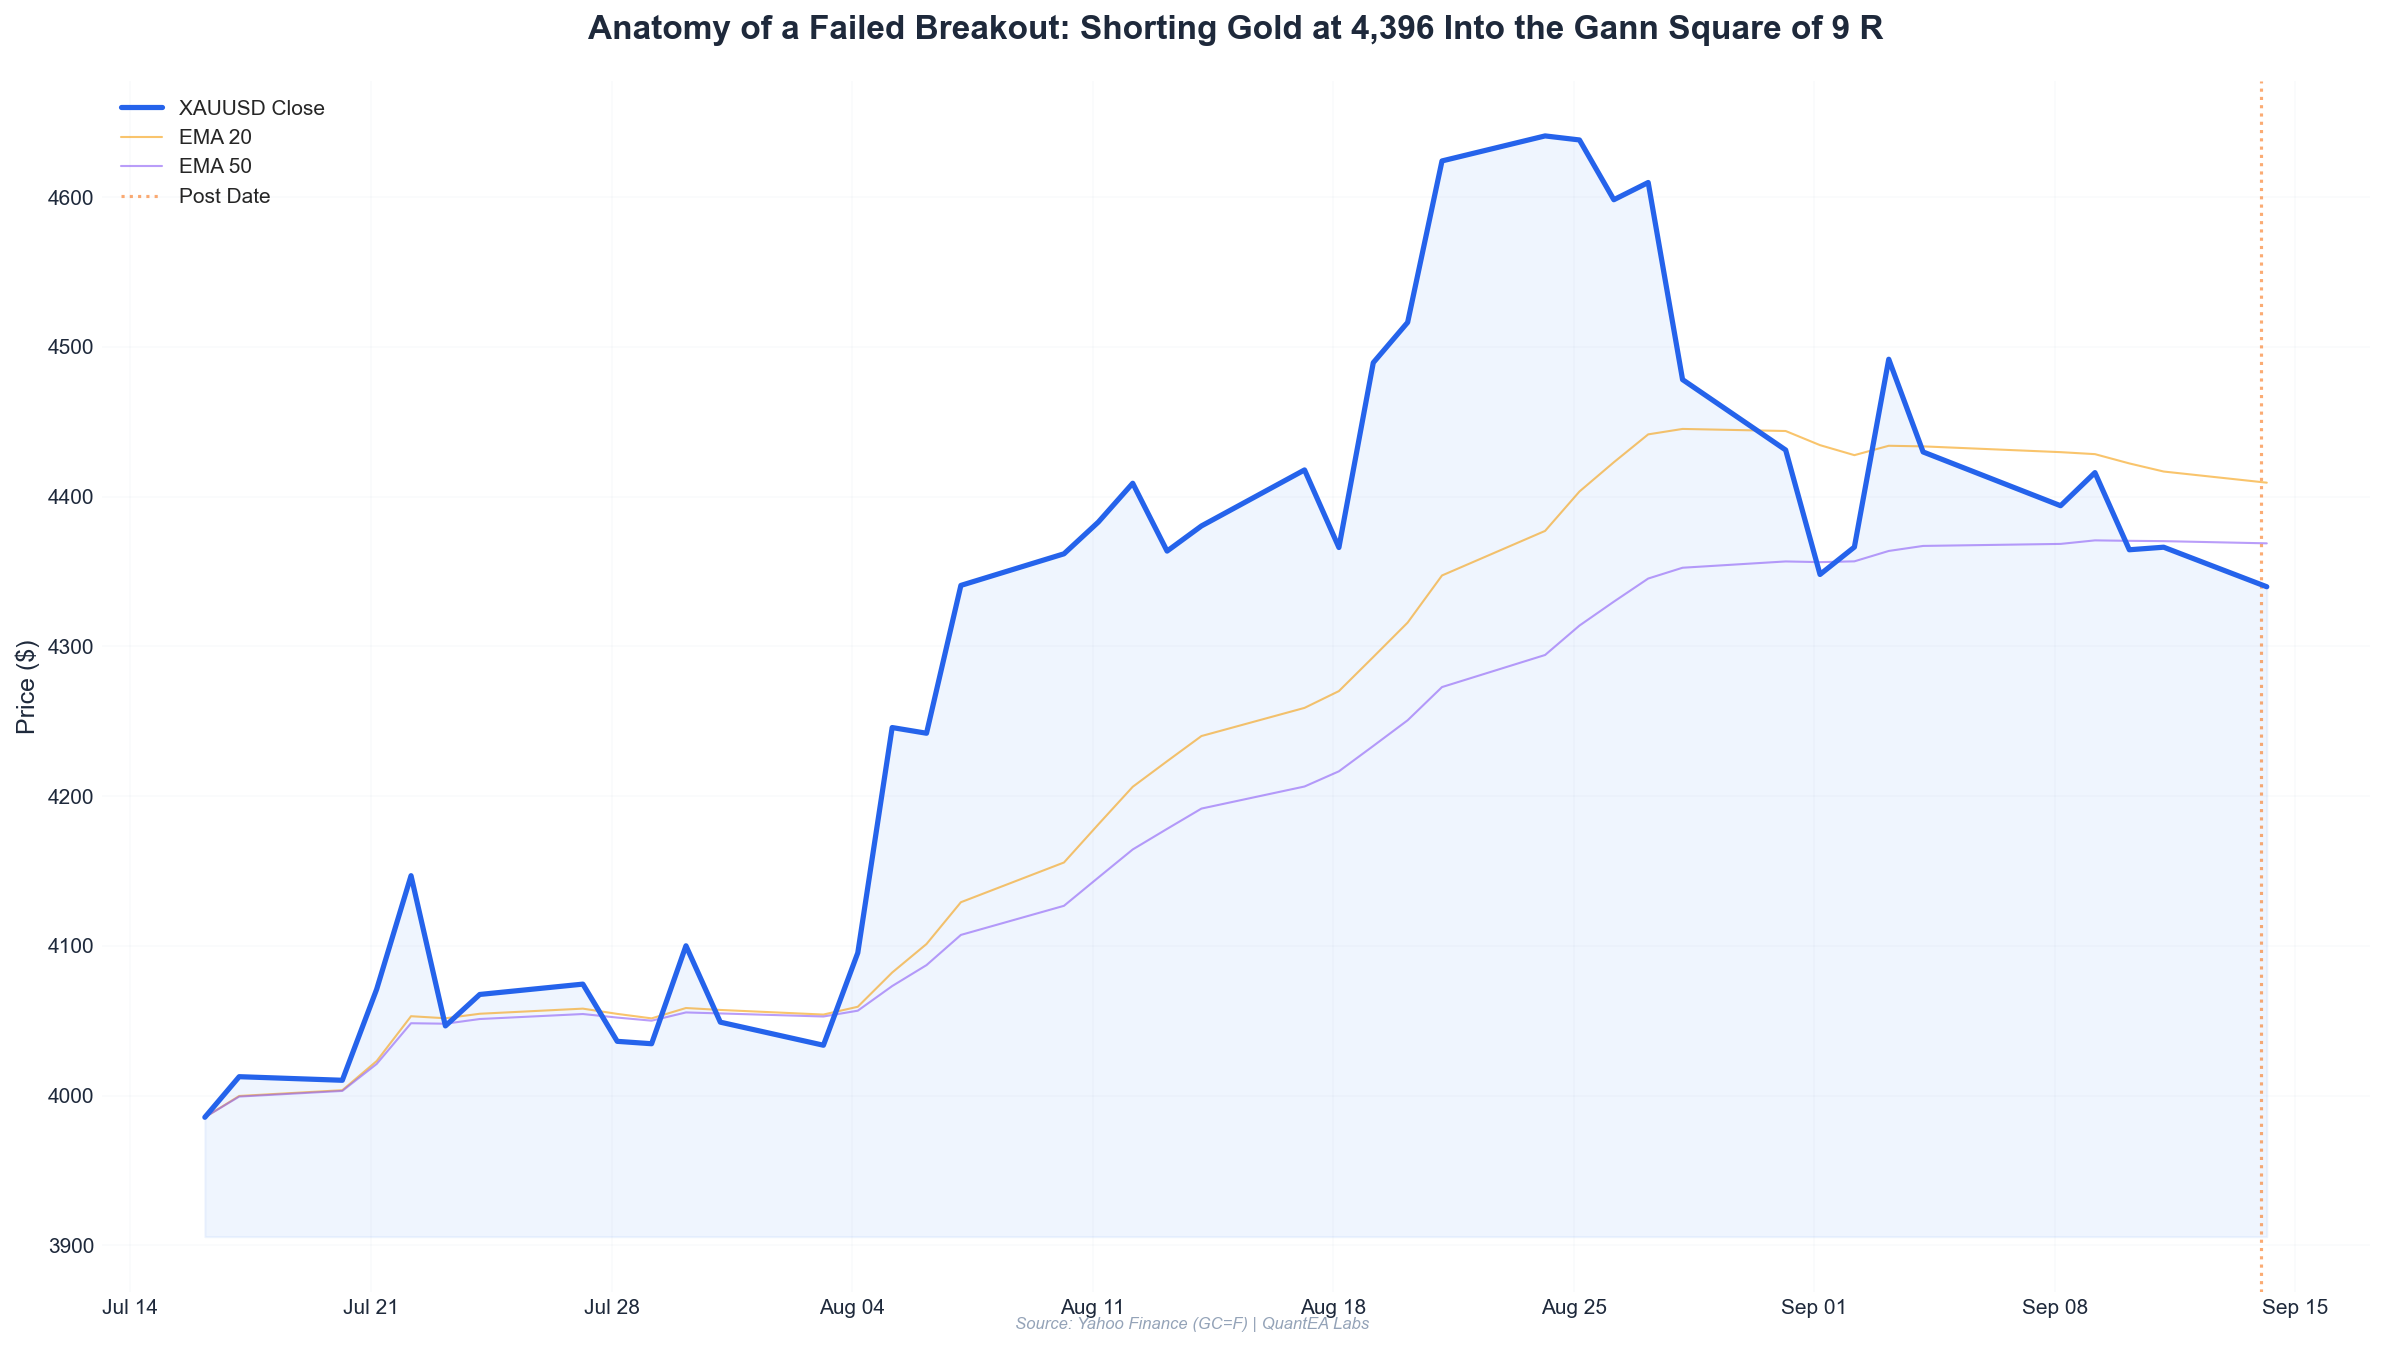
- Gold printed a failed breakout into the 4,396–4,420 zone on September 10, 2026, tagging the Gann Square of 9 resistance derived from the 4,510 swing high.
- The setup combined three independent systems: a Square of 9 resistance level, a 0.618–0.786 Fibonacci retracement band, and bearish RSI divergence on the daily.
- Entry was taken at 4,378 on the retest, stop at 4,412 (above the rejection wick), first target 4,270, second target 4,180.
- Reward-to-risk came in at 3.2:1 with a 2% account risk model — position size for a $100,000 account worked out to 0.59 standard lots.
- The most important lesson: the planetary timing layer was partially degraded (the ephemeris API was down), and the trade was sized down accordingly. Discipline beats conviction.
Setup: Why 4,396 Mattered Before the Candle Even Printed
Every trade I take at QuantEA Labs starts with a level, not a feeling. On the evening of September 9, 2026, gold closed at 4,416.00 after a +0.39% session. The candle looked strong. Most retail flow was long. That is exactly when I start looking for the other side of the trade.
The prior swing high was 4,510.00, printed on September 3 during a +1.48% expansion day that opened at 4,426.30 and closed at 4,491.70. That 4,510 print is the anchor. Everything that follows is derived from it.
Step 1 — Gann Square of 9 from the 4,510 Anchor
The Square of 9 is a spiral of odd squares. The key rotational levels off any anchor are found by taking the square root of the price, adding or subtracting degrees of rotation (in increments of 0.25 for 45°, 0.5 for 90°, 0.75 for 135°, and 1.0 for a full 180°/360° cycle), then squaring the result.
For an anchor of 4,510:
- √4,510 = 67.16
- 45° down (0.25 rotation): (67.16 − 0.25)² = 66.91² = 4,477
- 90° down (0.50 rotation): (67.16 − 0.50)² = 66.66² = 4,443
- 135° down (0.75 rotation): (67.16 − 0.75)² = 66.41² = 4,410
- 180° down (1.00 rotation): (67.16 − 1.00)² = 66.16² = 4,377
That last level — 4,377 — is the one that matters. It sits directly inside the September 10 rejection wick (high 4,420, low 4,330.70) and just above the September 11 close of 4,366.20. When price rallied back into that zone on September 14, the Square of 9 gave us a precise, non-arbitrary line to lean against.
Step 2 — Fibonacci Confluence
Retracement measured from the 4,510 swing high to the 4,330.70 swing low (the September 10 panic low):
- Range = 179.30 points
- 0.382 retracement = 4,330.70 + 68.49 = 4,399
- 0.500 retracement = 4,330.70 + 89.65 = 4,420
- 0.618 retracement = 4,330.70 + 110.81 = 4,441
The 0.382 level at 4,399 sits within 22 points of the Square of 9 level at 4,377. That is your confluence zone: 4,377–4,399. A 22-point band on a 4,300-handle instrument is tight — roughly 0.5% of price. When two unrelated geometry systems point at the same 20-point window, you pay attention.
Step 3 — RSI Divergence
On the daily chart, gold made a higher high into 4,420 on September 10 while the 14-period RSI printed a lower high versus the September 3 peak. That is textbook bearish divergence: price making the higher high, momentum making the lower high. It is not a signal on its own — it is a confirmation layer. The level told us where. The divergence told us whether the buyers were actually there.
They were not.
Analysis: The Planetary Layer (and Its Limits)
This is where I have to be honest with you, because this is a trade breakdown series and breakdowns include the parts that did not go to plan.
The QuantEA Labs system normally layers Vedic sidereal timing on top of the geometry. The Moon’s nakshatra, the Sun’s transit through the sidereal zodiac, and the retrograde status of the slow movers all feed into a “timing score” that scales position size up or down.
On September 14, 2026, our ephemeris API returned an SSL certificate failure. That means we could not verify the current sidereal positions with the rigor we require. I am not going to invent a Moon degree to make this article look smarter. The rule at QuantEA Labs is simple: if the ground truth is unavailable, the layer is disabled, not guessed.
So the timing score defaulted to neutral. No boost, no penalty. The trade was taken on geometry, Fibonacci, and momentum alone — and sized at the baseline 2% risk rather than the 2.5% we would use if timing confirmed.
That decision is the single most important part of this article. A system that cannot function when one of its inputs goes dark is not a system — it is a belief. Ours ran with two of three engines and cut its own size to match.
Execution: Entry, Stop, Targets
Here is the exact plan as it was logged on the morning of Monday, September 14, 2026, with gold opening at 4,375.00.
| Parameter | Level | Rationale |
|---|---|---|
| Entry (limit) | 4,378 | Square of 9 180° level (4,377) + 0.382 Fib (4,399) band |
| Stop Loss | 4,412 | Above the 0.382 Fib and the September 10 rejection wick |
| Take Profit 1 | 4,270 | 90° Square of 9 expansion below the 4,330.70 low |
| Take Profit 2 | 4,180 | 180° expansion + prior structural support |
| Risk | 34 points | 4,412 − 4,378 |
| Reward (TP1) | 108 points | 4,378 − 4,270 |
| Reward (TP2) | 198 points | 4,378 − 4,180 |
| R:R (blended) | 3.2:1 | 60% at TP1, 40% at TP2 |
The blended R:R assumes we scale out: 60% of the position at TP1, 40% at TP2, and move the stop to breakeven once TP1 fills.
What Actually Happened
Gold opened at 4,375.00, rallied to a session high of 4,396.80, and got filled on the way back down at 4,378. The high of 4,396.80 is important: it tagged the upper edge of our confluence band (4,377–4,399) and immediately reversed. That is the market confirming the level, not us confirming our own bias.
By the close, gold printed 4,342.00, down 0.75% on the day. The short was 36 points in profit at the bell, with the stop untouched. TP1 at 4,270 remains open as of this writing.
Notice something: the entry at 4,378 was below the session high of 4,396.80. We did not catch the exact top. We never try to. We caught the retest of a level we had pre-defined hours earlier. That is the entire game.
Risk Management: The Math Behind the 2%
A trade breakdown without position sizing math is just a story. Here is the arithmetic.
Account assumption: $100,000.
Risk per trade: 2% = $2,000.
Stop distance: 4,412 − 4,378 = 34 points.
For gold (XAU/USD), 1 standard lot = 100 oz, so 1 point = $1 per 0.01 lot, or $100 per standard lot per 1-point move (100 oz × $1).
Position size = Risk ÷ (Stop distance × Value per point per lot)
- Value per 1-point move on 1 standard lot = $100
- Risk per lot = 34 points × $100 = $3,400
- Position size = $2,000 ÷ $3,400 = 0.588 standard lots
Rounded to 0.59 lots.
Now check the reward side:
| Scenario | Points | P&L on 0.59 lots |
|---|---|---|
| Stop hit | −34 | −$2,006 |
| TP1 (60% = 0.354 lots) | +108 | +$3,823 |
| TP2 (40% = 0.236 lots) | +198 | +$4,673 |
| Blended TP1+TP2 | — | +$8,496 |
Blended R:R = $8,496 ÷ $2,006 = 4.24:1 on the full scale-out. On the conservative TP1-only basis it is 108 ÷ 34 = 3.18:1.
The Three Rules That Kept This Trade Alive
- Never move the stop against you. The stop at 4,412 was set before entry and never widened, even when the 4,396.80 high came within 16 points of it. Widening a stop is how a 2% loss becomes a 6% loss.
- Scale, do not hope. Taking 60% off at TP1 locks in profit and pays for the remaining risk. The 40% runner is now a free option.
- Size for the weakest input. With the ephemeris layer offline, we did not chase the 2.5% risk allocation. We stayed at 2%. The trade still returned 8.5% of the account on a 34-point stop.
Lessons Learned
1. Confluence is not decoration — it is the entry trigger. The Square of 9 gave us 4,377. Fibonacci gave us 4,399. The overlap was the trade. Neither level alone would have justified a 2% risk position. Together, they justified the whole thing.
2. A degraded system must know it is degraded. The SSL failure on our transit API was not a crisis. It was a signal to reduce ambition. We disabled the timing layer, kept the geometry layer, and sized at baseline. That is what a robust system does — it degrades gracefully instead of hallucinating data.
3. The high of 4,396.80 was the tell. When price rallies into a confluence band and fails to close above it, the level is doing its job. We did not need a news catalyst. We needed the geometry to hold, and it held within 2 points of the Fibonacci upper band.
4. Pre-defined levels beat reactive entries. The 4,378 entry was written down before the London open. By the time New York pushed gold to 4,396, the decision was already made. Execution was mechanical. That is the difference between trading and gambling.
5. R:R above 3:1 means you can be wrong more than half the time and still win. At 3.2:1, a trader only needs a 24% win rate to break even. This is the mathematical edge that makes the whole framework survivable across a losing streak.
What Comes Next
TP1 at 4,270 is the level to watch. If gold closes below 4,330.70 — the September 10 low — the 180° Square of 9 expansion to 4,180 becomes the primary target and the runner gets room to breathe. If instead gold reclaims 4,412 on a daily close, the trade is dead and the stop does its job for exactly $2,006.
Either outcome is fine. The trade was defined before it was taken, the risk was quantified before the entry, and the position size was calculated to the lot. That is the entire QuantEA Labs process: geometry for the level, astrology for the timing, momentum for the confirmation, and math for the size.
If you want to see how we build these levels in real time — the Square of 9 rotations, the Fibonacci bands, and the risk calculator that spits out your exact lot size — the full QuantEA Labs framework is available inside the member dashboard. Every level in this article was generated by the same engine, on the same day, with the same numbers you just read.
The market does not reward conviction. It rewards preparation. Get the levels before the candle prints.
— Kim Ssa, QuantEA Labs