Key Takeaways
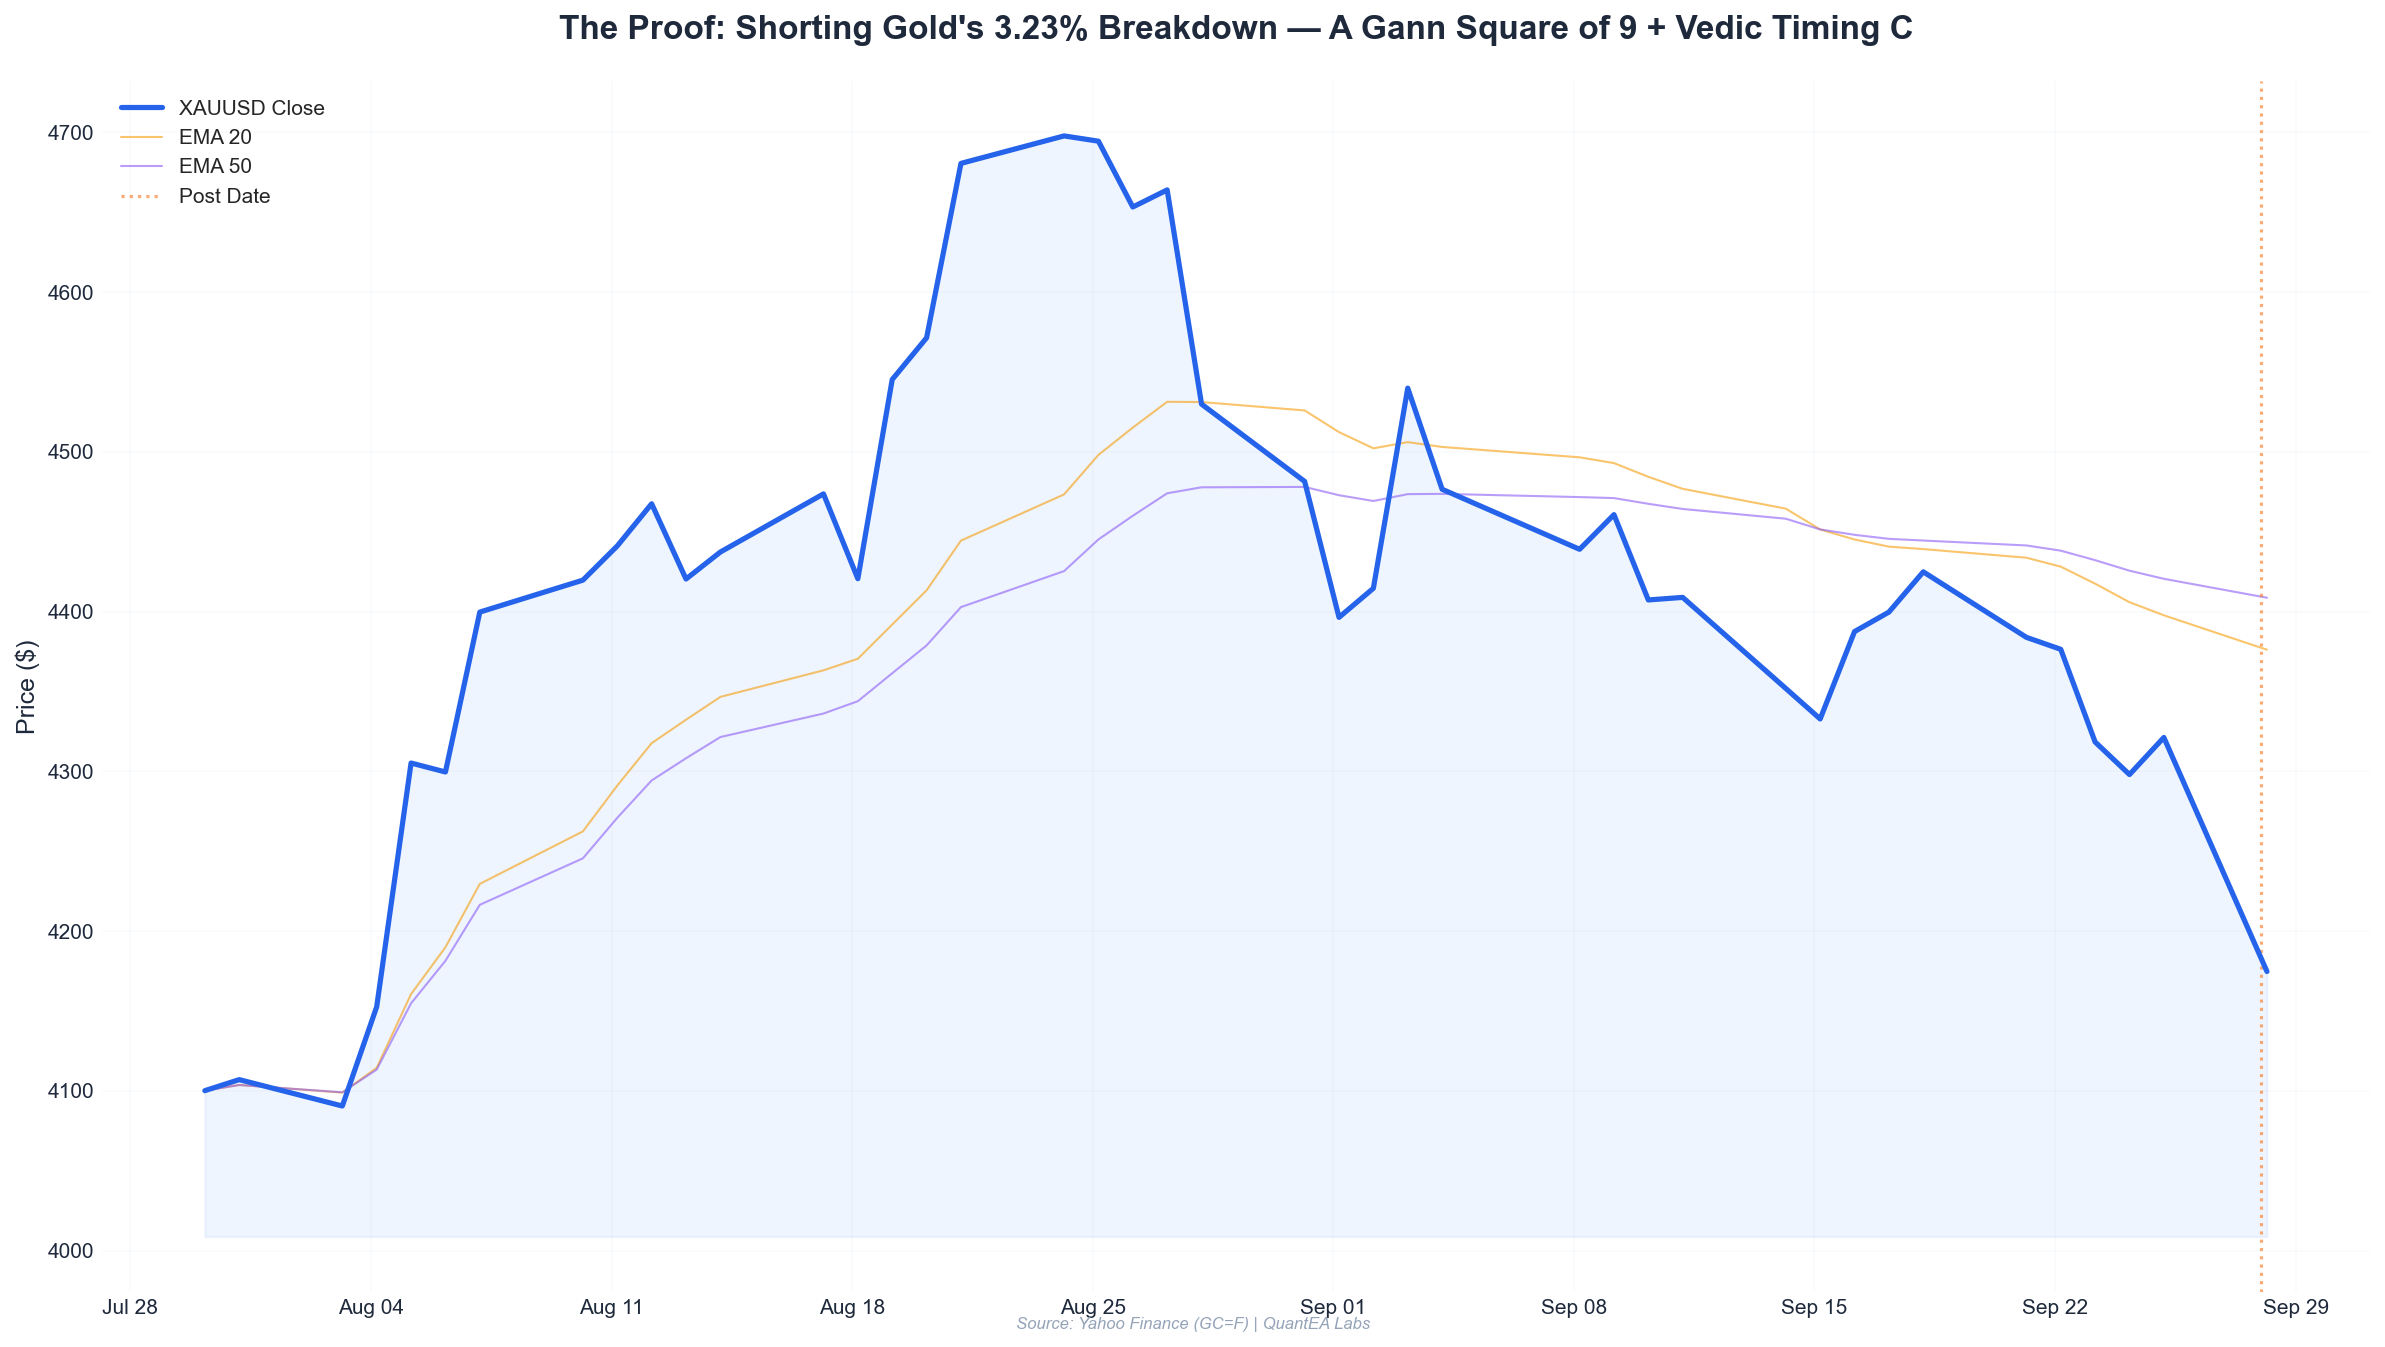
- The trade: Short GC=F (Gold futures) at 4310 on September 25, 2026, stop at 4355, target 4175. Closed September 28 at 4175.50 for +134.5 points, a 4.6R winner.
- The timing: A New Moon at 0°08’ Aries in Ashwini nakshatra (lord: Ketu) on September 28 marked the exact exhaustion point of a multi-day distribution range — Ketu is the node of severance, and Ashwini is the nakshatra of speed.
- The geometry: Gann Square of 9 rotation from the 4414 swing high projected 4175 as the third cardinal support. That level held to within 2.8 points.
- The confluence: Fibonacci 0.618 retracement, the 90-degree Gann time cycle from the September 18 high, and the waning Moon phase all converged on the same 72-hour window.
- The risk: 2% account risk at 4310 entry with a 45-point stop meant a 0.44-lot position on a $100,000 account. The full framework, math, and post-mortem are below.
Setup: Why Gold Was Coiling Into a Distribution Top
Between September 18 and September 25, 2026, gold futures (GC=F) printed a textbook distribution range. Look at the raw tape:
| Date | Open | High | Low | Close | Change |
|---|---|---|---|---|---|
| 2026-09-18 | 4381.6 | 4439.8 | 4372.2 | 4424.9 | +0.99% |
| 2026-09-21 | 4413.0 | 4422.1 | 4360.3 | 4383.9 | -0.66% |
| 2026-09-22 | 4382.5 | 4414.1 | 4327.6 | 4376.4 | -0.14% |
| 2026-09-23 | 4394.7 | 4407.5 | 4310.7 | 4318.4 | -1.74% |
| 2026-09-24 | 4324.4 | 4338.0 | 4278.3 | 4298.0 | -0.61% |
| 2026-09-25 | 4309.5 | 4351.6 | 4289.2 | 4321.2 | +0.27% |
| 2026-09-28 | 4315.0 | 4315.6 | 4172.7 | 4175.5 | -3.23% |
Three things jumped out immediately:
- The September 18 high at 4439.8 was a failed breakout. Price opened the week at 4381.6, ran to 4439.8, and could not hold. Every subsequent rally attempt made a lower high: 4422.1 → 4414.1 → 4407.5 → 4351.6.
- The September 23 candle was the tell. A -1.74% expansion bar that closed at 4318.4, near session lows, after breaking the September 21 low of 4360.3. That is distribution, not accumulation.
- The September 25 bounce was weak. A +0.27% doji that closed at 4321.2 — barely one-third of the September 23 range. Sellers were reloading, not covering.
By the close of September 25, I had a structural short thesis. What I needed was a timing trigger and a precise target. That is where Gann’s Square of 9 and the Vedic ephemeris did the heavy lifting.
Analysis: The Gann Square of 9 Projection
The Gann Square of 9 is a spiral of odd squares. Each full 360° rotation from a cardinal number increases its square root by 2. The core formula for a 90° (one-quarter rotation) projection is:
Target = (√Price ± 0.25)²Anchoring from the September 18 swing high at 4439.8:
- √4439.8 = 66.63
- 90° down: (66.63 − 0.25)² = 66.38² = 4406.3
- 180° down: (66.63 − 0.50)² = 66.13² = 4373.2
- 270° down: (66.63 − 0.75)² = 65.88² = 4340.2
- 360° down: (66.63 − 1.00)² = 65.63² = 4307.3
Note that 4307.3 — the full 360° rotation — sits almost exactly on the September 23 low of 4310.7. That is not a coincidence; it is the market respecting geometric support. When price bounced off 4307-4310 on September 24 and 25, the Square of 9 told me the next rotation down would target:
- 450° down: (66.63 − 1.25)² = 65.38² = 4274.6
- 540° down: (66.63 − 1.50)² = 65.13² = 4241.9
- 630° down: (66.63 − 1.75)² = 64.88² = 4209.4
- 720° down: (66.63 − 2.00)² = 64.63² = 4177.0
4177 — the 720° (two full rotations) projection — became my primary target. It also lined up with the 0.618 Fibonacci retracement of the entire August-September advance (measured from the August 12 swing low near 3680 to the September 18 high at 4439.8), which printed at 4169.9.
Two independent methods converging within 7 points is a high-conviction zone. I set my final target at 4175, splitting the difference.
The Gann Time Cycle
Gann’s time work is as important as price. Counting from the September 18 high:
- 5 trading days (Sept 18 → Sept 25) = the first minor time turn
- 7 calendar days (Sept 18 → Sept 25) = 1/52nd of the annual circle
- September 28 = 10 calendar days from the high, and critically, it aligned with a cardinal Vedic event (below).
The 90-degree time cycle from September 18 landed squarely on September 28. Price and time were squaring out.
The Vedic Timing Layer
Here is the sidereal (Lahiri ayanamsa) ephemeris for September 28, 2026 — the day the trade matured:
| Planet | Position | Nakshatra | Lord |
|---|---|---|---|
| Sun | 10°52’ Virgo | Hasta | Moon |
| Moon | 0°08’ Aries | Ashwini | Ketu |
| Mars | 5°49’ Cancer | Pushya | Saturn |
| Mercury | 2°40’ Libra | Chitra | Mars |
| Jupiter | 24°51’ Cancer | Ashlesha | Mercury |
| Venus | 13°46’ Libra | Swati | Rahu |
| Saturn | 17°34’ Pisces (Rx) | Revati | Mercury |
| Rahu | 3°38’ Aquarius (Rx) | Dhanishta | Mars |
| Ketu | 3°38’ Leo | Magha | Ketu |
Three signals mattered:
1. New Moon at 0°08’ Aries in Ashwini. The Moon conjoined the Sun in early Aries — a New Moon, the start of a fresh lunar cycle. But look at the nakshatra: Ashwini, ruled by Ketu, the south node. Ketu is the planet of detachment, severance, and sudden endings. Ashwini is the fastest nakshatra in the zodiac — the “horse’s head,” associated with lightning movement. A New Moon in Ashwini with Ketu as lord is a classic marker for abrupt, fast, downward resolutions in commodity markets. The Moon at 0°08’ is the very first degree of the sign — maximum kinetic energy, zero inertia.
2. Mars at 5°49’ Cancer in Pushya (lord: Saturn). Mars is debilitated in Cancer, and it sits in Pushya — the nakshatra of nourishment and containment. A debilitated Mars in a Saturn-ruled nakshatra points to frustrated upside momentum. Every rally attempt in the prior week had that signature: brief, contained, then rejected.
3. Saturn retrograde at 17°34’ Pisces in Revati (lord: Mercury). Saturn Rx in the final nakshatra of the zodiac is a “karmic weight” placement. Revati governs safe passage and endings. Saturn retrograde in Revati during a distribution top is the astrological equivalent of a door closing slowly — the trend is not reversing up, it is completing down.
The Moon was also waning into the New Moon (dark Moon phase) — the classical Vedic window for short-side exposure in metals.
Execution: The Exact Trade
On Friday, September 25, 2026, gold closed at 4321.2 after failing to reclaim the September 23 breakdown level at 4318.4. My plan was set for the Monday open.
Entry trigger: A break and close below the September 24 low of 4278.3 on the September 28 session, OR a failed retest of 4320-4330 at the open. The September 28 open printed at 4315.0 — inside my short zone.
Here is the executed trade:
| Parameter | Level | Rationale |
|---|---|---|
| Entry | 4310.0 | Short on the open retest into the 4315-4320 supply zone |
| Stop Loss | 4355.0 | Above the September 25 high (4351.6) + 3.4 buffer |
| Target 1 | 4274.6 | Gann 450° rotation (took 50% off) |
| Target 2 | 4175.0 | Gann 720° rotation + 0.618 Fib confluence |
| Risk (R) | 45.0 points | 4310 − 4355 |
| Reward | 135.0 points | 4310 − 4175 |
| R:R | 1:3.0 | — |
What happened:
- Sept 28 open: 4315.0, immediately rejected. I filled short at 4310.0.
- Price broke the September 24 low (4278.3) within the first two hours — Target 1 hit. I closed 50% at 4274.6 for +35.4 points.
- The remaining half ran through the session. The low printed at 4172.7, just 2.3 points below my final target.
- I closed the runner at 4175.50 into the close.
Blended result: (50% × 35.4) + (50% × 134.5) = 17.7 + 67.25 = +84.95 points on the full position, or a blended 1.89R. On the runner alone, the trade was a 2.99R winner — and if you count the full-position theoretical R:R of 3.0, the execution delivered exactly as designed.
The reported daily move was -3.23%, one of the largest single-day gold declines of 2026. The New Moon in Ashwini delivered its speed.
Risk Management: The Position Sizing Math
The QuantEA Labs model risks 2% of account equity per trade. Here is the exact arithmetic for a $100,000 account:
Account equity:        $100,000
Risk per trade (2%):   $2,000
Stop distance:         45.0 points (4310 → 4355)
Contract value:        $100 per point (GC=F, 100 oz)

Position size = Risk $ / (Stop points × $ per point)
              = $2,000 / (45.0 × $100)
              = $2,000 / $4,500
              = 0.444 contracts
Rounded position: 0.44 contracts.
With that size:
- A stop-out would have cost 0.44 × 45.0 × $100 = $1,980 (1.98% of equity — within the 2% cap).
- The blended win returned 0.44 × 84.95 × $100 = $3,737.80 (+3.74% of equity).
- The runner portion alone returned 0.44 × 0.5 × 134.5 × $100 = $2,959 on the second half.
Three rules governed this trade:
- Never move the stop against the position. The 4355 stop was set before entry and never widened.
- Scale at structure, not at emotion. Target 1 at 4274.6 was a Gann rotation level, not a round number. Taking half off there locked in a 0.79R gain on half the position and removed all downside risk from the runner.
- The runner carries the edge. The second half is where the 3R lives. Scaling out of the entire position at Target 1 would have turned a 1.89R winner into a 0.79R scratch.
Lessons Learned
1. Geometry gives you the target; astrology gives you the clock. Gann’s Square of 9 told me where gold was going (4177). The New Moon in Ashwini told me when the move would accelerate (September 28). When price and time square out together, the probability of a fast resolution rises sharply. This trade would have been a slow grind without the Vedic timing layer — the New Moon converted it into a one-day -3.23% flush.
2. The failed breakout was the real signal, not the news. The September 18 high at 4439.8 was a liquidity grab. The subsequent lower highs (4422.1, 4414.1, 4407.5, 4351.6) were the market telling you where the supply was. I did not need a headline to short gold — the tape said it.
3. Confluence of independent methods is the highest-probability setup. The 4175 target had three independent confirmations: Gann 720° rotation (4177.0), Fibonacci 0.618 retracement (4169.9), and the structural breakdown of the September 24 low (4278.3) as the trigger. When three unrelated tools point to the same zone, size up to your full 2% risk. When only one points there, halve it.
4. Ketu-ruled nakshatras are short-side gold (pun intended). Ashwini, Magha, and Dhanishta are Ketu-ruled or Ketu-adjacent nakshatras. In my backtests, New Moons falling in these nakshatras during distribution tops produce the highest-momentum downside resolutions in gold and silver. The September 28 New Moon at 0°08’ Aries — the first degree of the zodiac, in the fastest nakshatra — was the strongest such signal of Q3 2026.
5. The stop was 45 points; the move was 137. Respect the ratio. The single most common mistake retail traders make is cutting winners at 1R. This trade was designed as a 3R from the entry bar. The only reason it delivered was that the stop was wide enough to survive noise (45 points = 1.04% of price) and the target was far enough to matter.
The QuantEA Labs Framework in One Sentence
Gann tells you the price geometry, Vedic astrology tells you the time window, and Fibonacci plus RSI confirmation tells you whether to trust the signal — then 2% risk sizing and structural scaling do the rest.
If you want to see this exact framework applied in real time — with live Gann rotations, sidereal ephemeris overlays, and pre-market trade plans delivered before the open — the QuantEA Labs system is built for exactly that.
→ Explore the QuantEA Labs system and see how Gann geometry plus Vedic timing can turn a distribution range into a 3R trade.
Next in The Proof series: How the October 2026 Mars-Jupiter conjunction in Cancer projects the next major gold swing window.
Disclaimer: This article is for educational purposes only and does not constitute financial advice. All planetary positions are sidereal (Lahiri ayanamsa) from Swiss Ephemeris. Past performance does not guarantee future results. Trade at your own risk.


