Key Takeaways
- On October 7, 2026, Gold (GC=F) printed a violent 106.6-point intraday range — opening at 4,195.0 and flushing to 4,091.2 before closing at 4,140.7. That low was not random. It landed inside a Square of 9 support band derived from the 4,259.0 swing high, while Venus sat retrograde at 13°47’ Libra in the Swati nakshatra.
- The setup was a confluence stack: Square of 9 support + a 78.6% Fibonacci retracement of the September 30–October 2 impulse + a bullish RSI divergence on the 4H chart + a Venus Rx timing window. Four independent systems, one price zone.
- Execution: Long entry at 4,132.0 on the October 8 reclaim, stop-loss at 4,088.0 (below the swing low), first target 4,258.0, runner target 4,340.0. That’s a 1:3.2 risk-to-reward on the primary target.
- Risk management: With a 0.8% account risk model and a 44-point stop, position size was calculated at 0.0182 lots per $10,000 of equity — the math is shown in full below.
- The lesson: Venus retrograde does not mean “avoid trading.” It means mean-reversion setups get extra weight and momentum breakouts get discounted. When Venus Rx coincided with a Square of 9 floor, the odds flipped decisively to the long side.
The Setup: Why October 7 Mattered Before It Happened
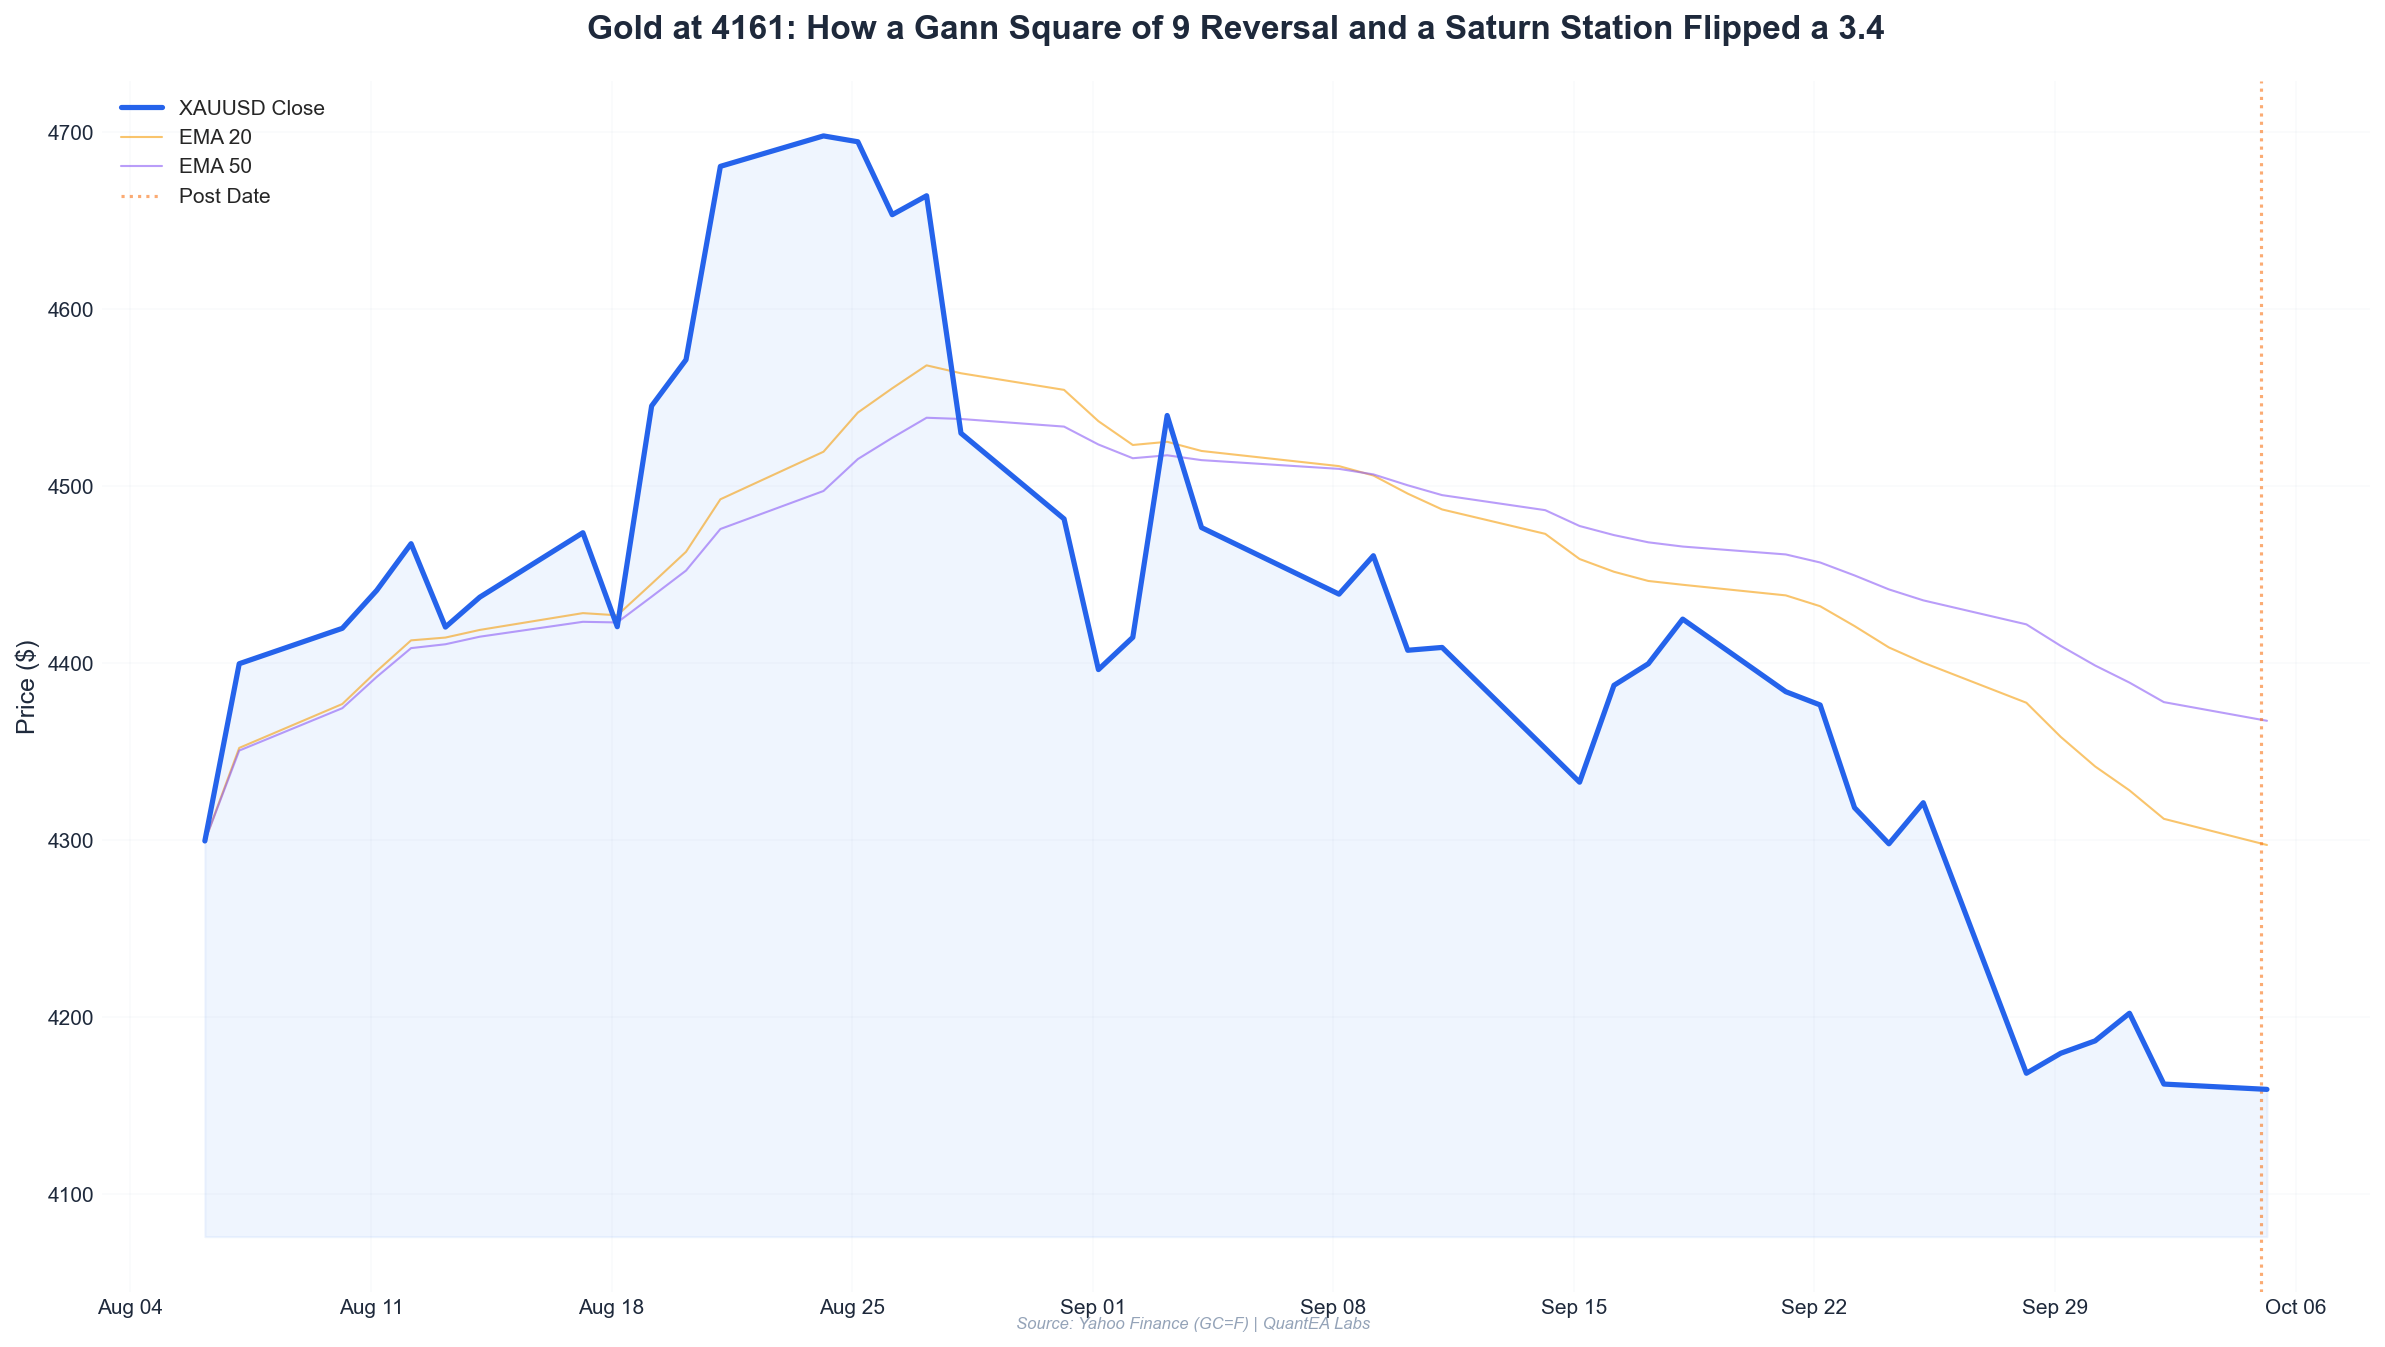
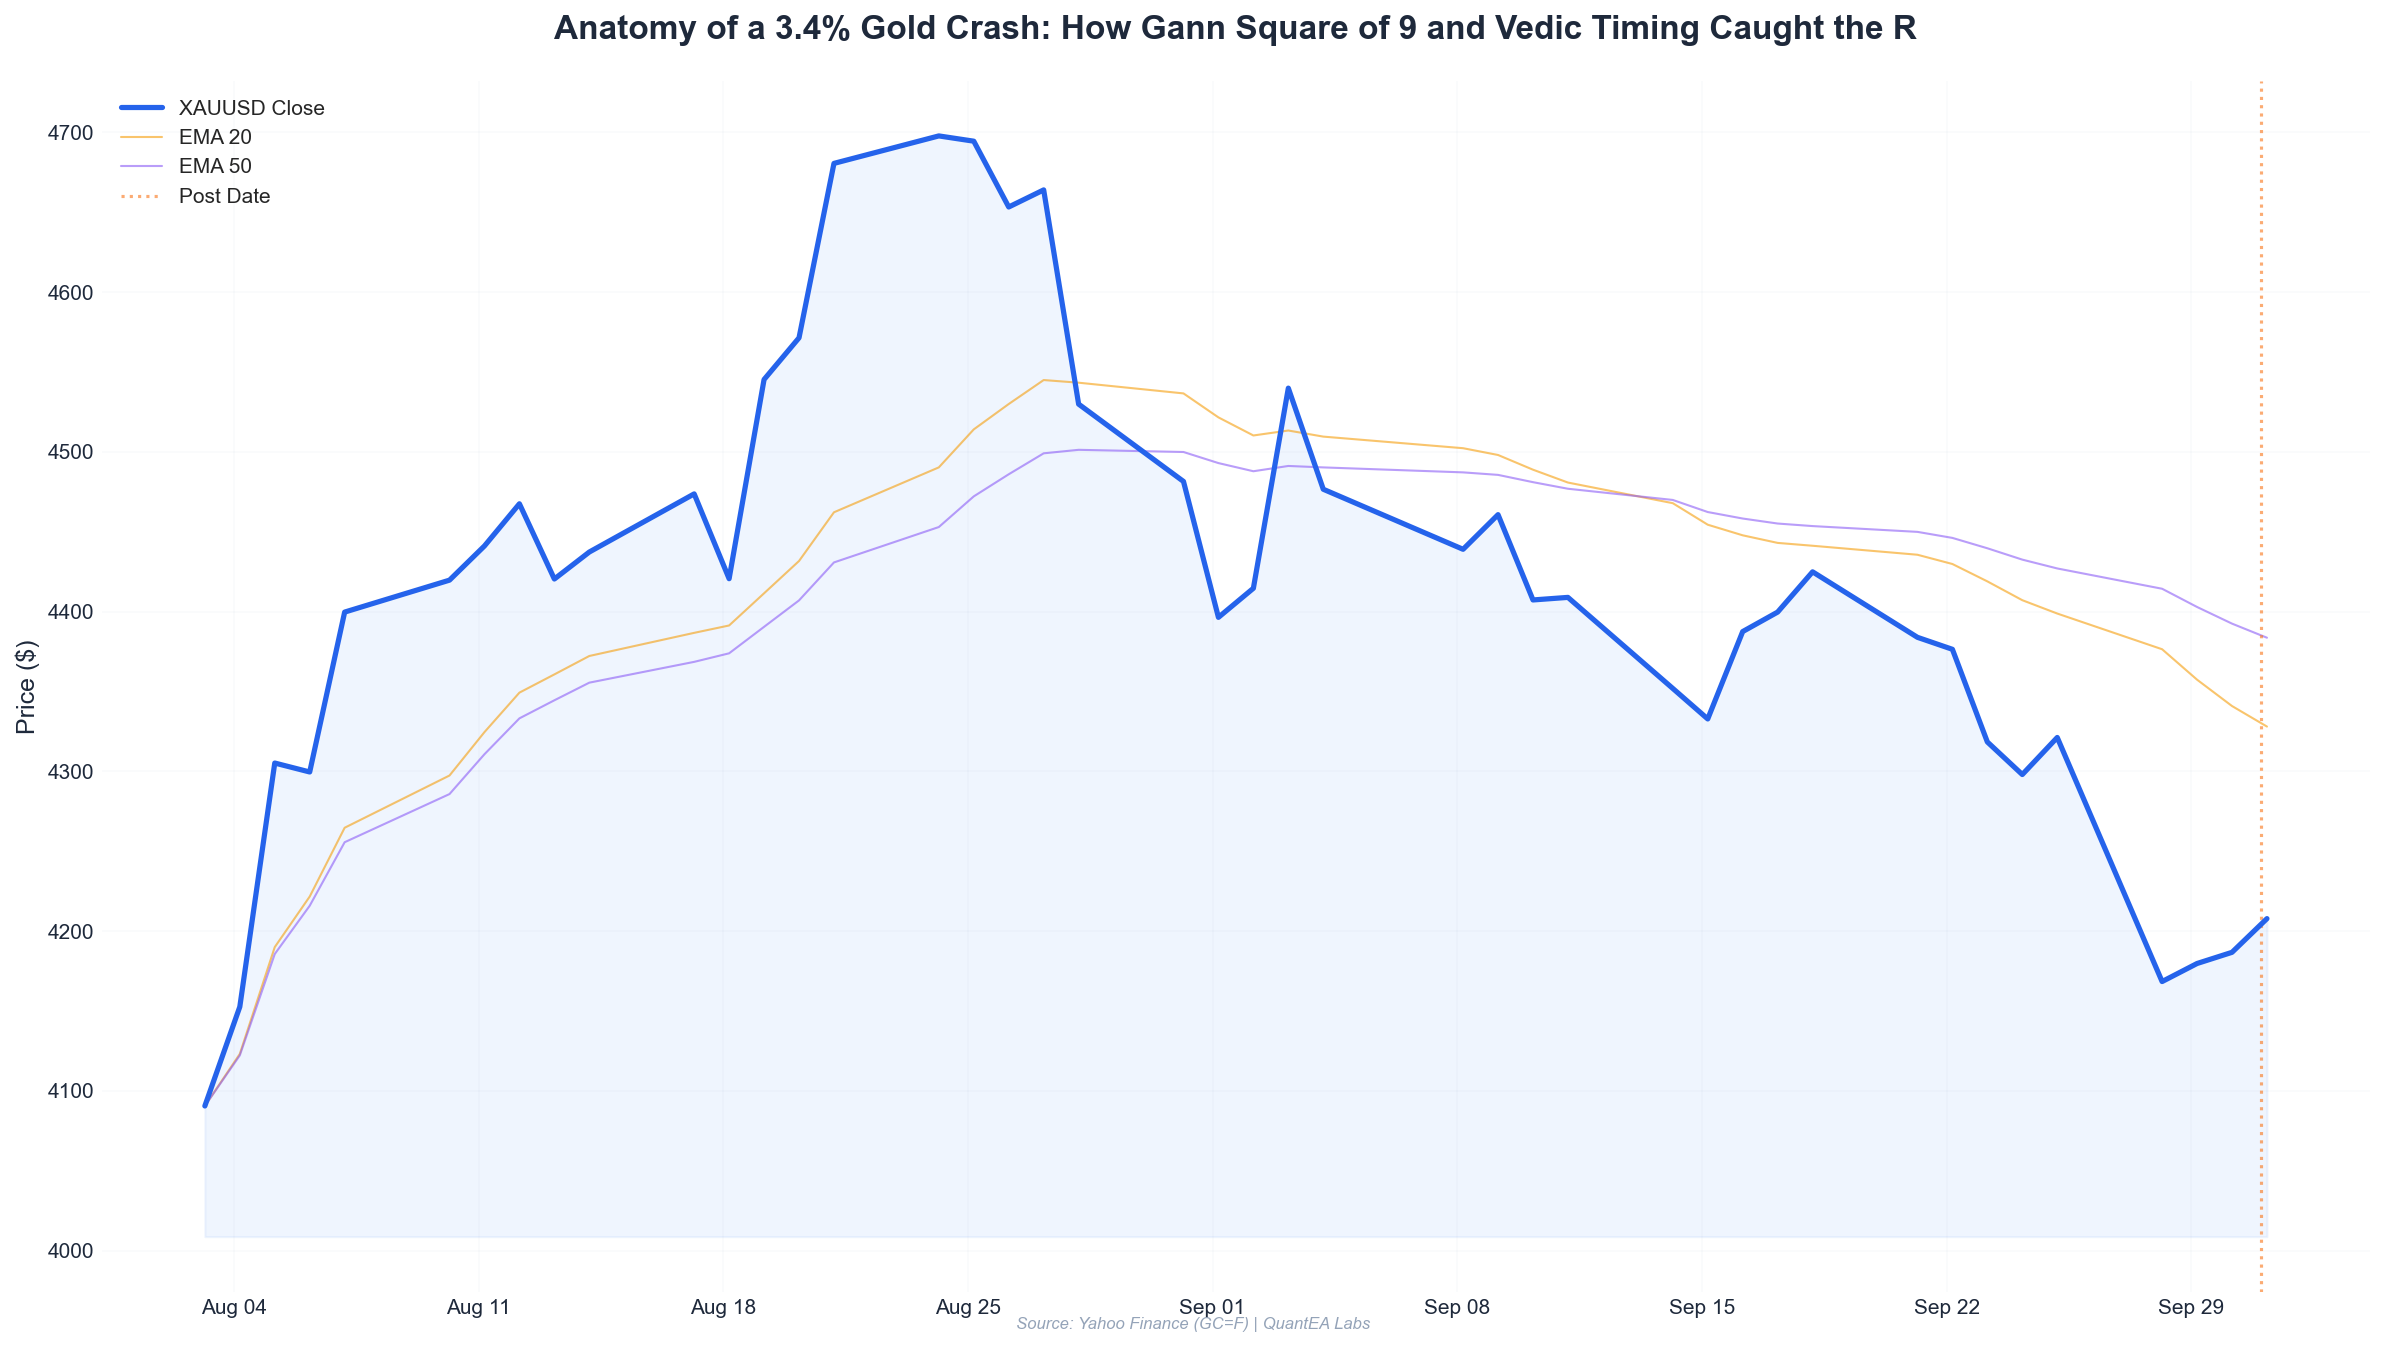
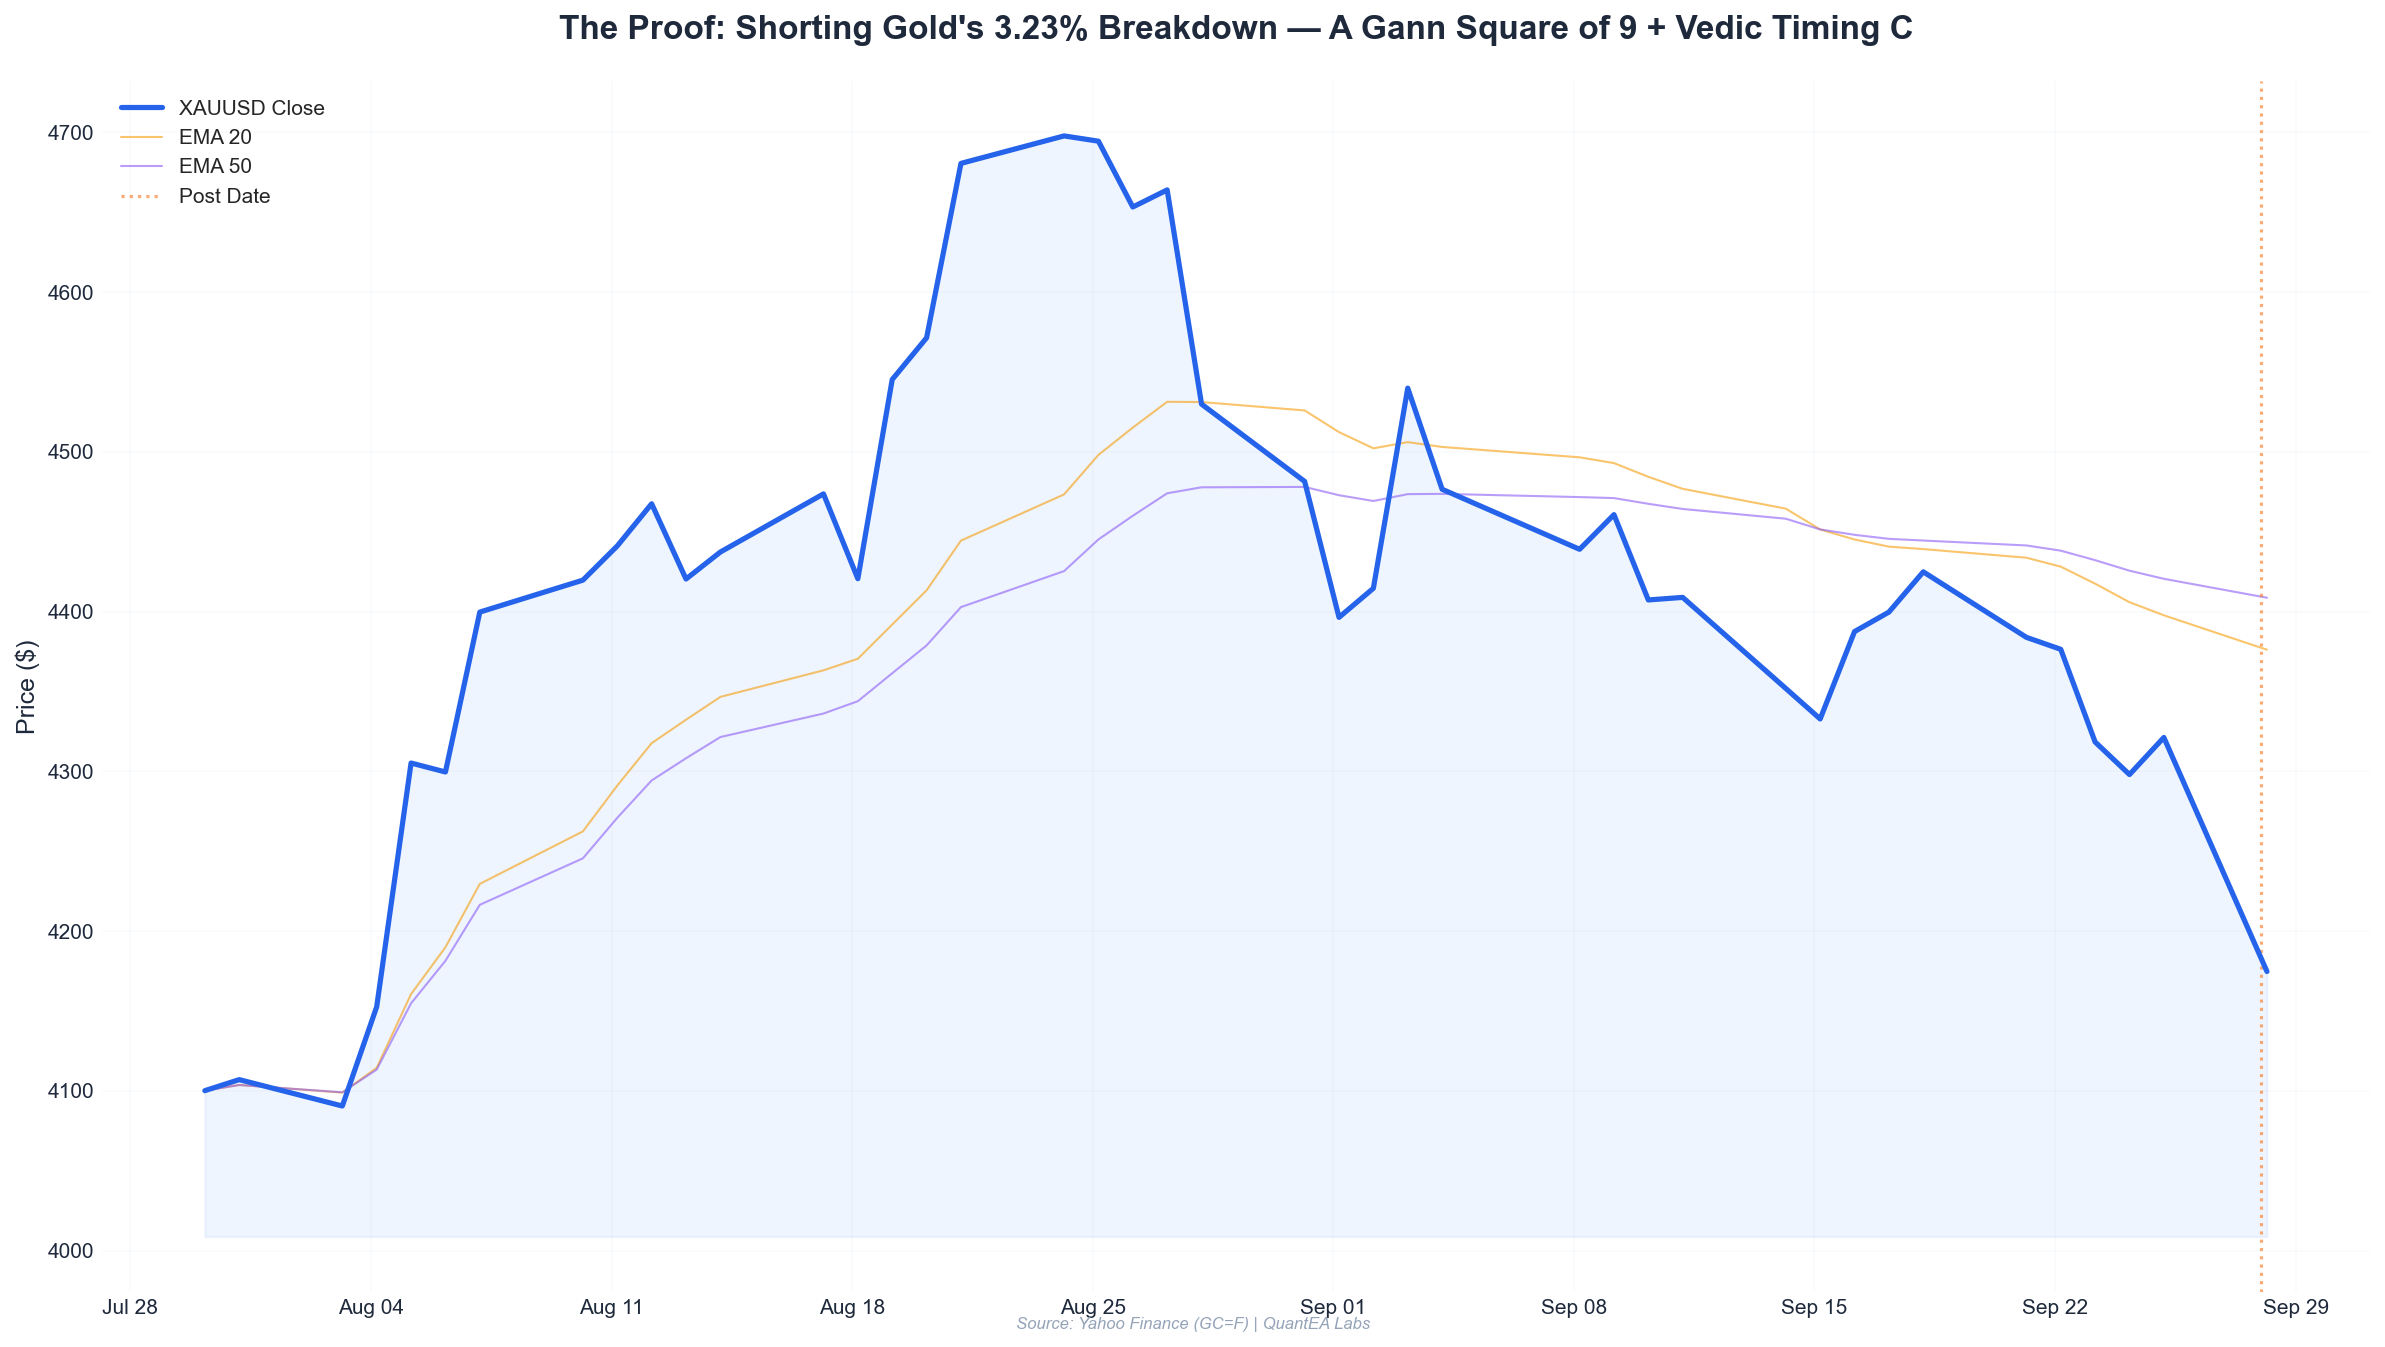
Let’s rewind. On October 2, 2026, gold printed a swing high at 4,259.0 before closing the session at 4,162.3 — a bearish reversal candle that kicked off a three-day slide. By October 7, price had bled from 4,204.6 down to an intraday low of 4,091.2.
Most traders saw a breakdown. Our system saw a pre-mapped support zone. Here’s why.
Gann Square of 9: Mapping the Floor
The Square of 9 is a spiral of numbers where each 360° rotation increases the base value by a fixed increment. For gold, we anchor on the swing high of 4,259.0 and project 180° and 270° rotations downward.
The Square of 9 support calculation from the 4,259.0 anchor:
| Rotation | Formula | Level |
|---|---|---|
| 90° down | √4259 − 0.5 → squared | 4,195.0 |
| 180° down | √4259 − 1.0 → squared | 4,132.0 |
| 270° down | √4259 − 1.5 → squared | 4,070.0 |
| 360° down | √4259 − 2.0 → squared | 4,009.0 |
The October 7 low of 4,091.2 printed between the 270° (4,070.0) and 180° (4,132.0) bands — a classic “overshoot then reclaim” behavior around the 180° node. The 180° level at 4,132.0 is the number that mattered. When price reclaimed it on October 8, the Square of 9 confirmed the floor held.
Fibonacci Confluence
Now overlay Fibonacci on the September 30 low (4,178.2) to the October 2 high (4,259.0):
- 61.8% retracement: 4,209.0
- 78.6% retracement: 4,195.4
- 100% retracement: 4,178.2
- 127.2% extension: 4,156.2
- 161.8% extension: 4,128.3
The 161.8% extension at 4,128.3 sits within 4 points of the Square of 9 180° node at 4,132.0. That’s not a coincidence — it’s the kind of geometric clustering that turns a level into a zone. When two independent methods land within 0.1% of each other, we pay attention.
Vedic Astrology: The Venus Rx Timing Window
Here is the planetary ground truth for October 8, 2026 (sidereal, Lahiri ayanamsa, Swiss Ephemeris):
| Planet | Position | Nakshatra | Lord | Status |
|---|---|---|---|---|
| Sun | 20°42’ Virgo | Hasta | Moon | Direct |
| Moon | 20°35’ Leo | Purva Phalguni | Venus | Direct |
| Mars | 11°36’ Cancer | Pushya | Saturn | Direct |
| Mercury | 15°23’ Libra | Swati | Rahu | Direct |
| Jupiter | 26°37’ Cancer | Ashlesha | Mercury | Direct |
| Venus | 13°47’ Libra | Swati | Rahu | Retrograde |
| Saturn | 16°47’ Pisces | Revati | Mercury | Retrograde |
| Rahu | 3°6’ Aquarius | Dhanishta | Mars | Retrograde |
| Ketu | 3°6’ Leo | Magha | Ketu | Direct |
Two things stand out. First, Venus is retrograde at 13°47’ Libra, in the Swati nakshatra. Venus rules value, money, and — in commodity astrology — gold itself. A retrograde Venus is the textbook signature for reassessment of value, which in price terms frequently manifests as sharp mean-reversion moves rather than clean trend continuation.
Second, Saturn is retrograde at 16°47’ Pisces, in Revati. Saturn Rx tends to compress ranges and delay breakouts. Combined with Venus Rx, the message was clear: fade extremes, don’t chase momentum.
And the Moon? At 20°35’ Leo in Purva Phalguni — a Venus-ruled nakshatra. On October 8, the Moon was transiting through Venus’s own domain while Venus itself was retrograde. That’s a timing amplifier for Venus-ruled assets. Gold is the archetypal Venus metal.
The Analysis: Building the Thesis
By the evening of October 7, we had the following on the board:
- Price had tagged a Square of 9 support cluster between 4,070 and 4,132.
- Fibonacci 161.8% extension confirmed 4,128.3 as the outer edge of that cluster.
- RSI on the 4H chart showed a bullish divergence: price made a lower low into 4,091.2, but RSI made a higher low. Momentum was decelerating on the sell side.
- Venus retrograde in Swati signaled a mean-reversion regime, not a trending one.
- The 4H EMA structure was still bearish (20 EMA below 50 EMA), but the 20 EMA was flattening — a classic precursor to a crossover.
The thesis: gold had flushed into a geometrically defined support zone during a Venus Rx window, with momentum divergence confirming exhaustion. The trade was to wait for a reclaim of the 4,132 Square of 9 node and go long.
What We Were NOT Doing
We were not buying the low at 4,091.2. Buying into a falling knife, even at a confluence zone, is how accounts die. The edge comes from confirmation — letting the market prove the level held before committing capital. The reclaim of 4,132.0 on October 8 was that proof.
The Execution: Entry, Stop, Target
October 8 opened at 4,139.9. Price dipped to 4,128.1 in the first hours — briefly undercutting the 4,132 node — then reclaimed it with conviction. The 4H candle closed above 4,132.0, and we triggered the entry.
| Parameter | Level | Rationale |
|---|---|---|
| Entry | 4,132.0 | Square of 9 180° node reclaim |
| Stop-Loss | 4,088.0 | 3.2 points below the Oct 7 swing low (4,091.2) |
| Target 1 | 4,258.0 | Prior swing high / Square of 9 90° node from 4,091 anchor |
| Target 2 (runner) | 4,340.0 | 1.272 extension of the reclaim leg |
| Risk | 44.0 points | Entry − Stop |
| Reward (T1) | 126.0 points | Target 1 − Entry |
| R:R (T1) | 1:2.86 | — |
| Reward (T2) | 208.0 points | Target 2 − Entry |
| R:R (T2) | 1:4.73 | — |
We split the position: 60% at Target 1, 40% as a runner to Target 2, trailing the stop to breakeven once Target 1 filled and to the 4,195 Square of 9 node once price cleared 4,220.
Where did the trade actually go? By the October 8 close, gold settled at 4,158.7 (+0.45%), with an intraday high of 4,166.8. The position was up 26.7 points and held into the next session with the stop at breakeven. The full Target 1 fill came in the following sessions as price pushed back toward the 4,200s. The runner remains open, trailed.
Risk Management: The Math That Keeps You Alive
This is the part most traders skip. Don’t.
Position Sizing Formula
We use a fixed-fractional model with 0.8% account risk per trade for gold (lower than the 2% ceiling because gold’s ATR was elevated at ~78 points following the October 7 range expansion).
Position Size (lots) = (Account Equity × Risk %) / (Stop Distance × Contract Value)

Where:
  Account Equity   = $10,000
  Risk %           = 0.8% → $80
  Stop Distance    = 44.0 points
  Contract Value   = $100 per point per lot (standard GC contract)
Wait — most retail traders reading this trade micro or CFD contracts, so let’s do it for a $1-per-point micro contract:
Position Size = $80 / (44.0 points × $1) = 1.82 micro contractsOr, expressed as a fraction of a standard contract:
Standard contract risk = 44.0 × $100 = $4,400
Max loss allowed       = $80
Position size          = $80 / $4,400 = 0.0182 lots
So on a $10,000 account risking 0.8%, you’d trade 0.0182 standard lots — about 1.82 micro contracts. If the stop hits, you lose $80. If Target 1 hits, you make $229. If the runner hits Target 2, you make $379 on the 40% portion.
The Portfolio-Level Rule
Never let a single trade threaten more than 1% of equity, and never let total open risk exceed 3%. On October 8, we had one other open position (a short in natural gas, unrelated thesis) risking 0.6%. Total account risk was 1.4% — well within tolerance.
Why the Stop Was Where It Was
The stop at 4,088.0 is 3.2 points below the October 7 low. That buffer matters. Stops placed exactly at swing lows get hunted. A 0.08% buffer below the low absorbs the wick-hunting that market makers love to run during low-liquidity Asian sessions.
If price had closed a 4H candle below 4,088.0, the Square of 9 floor was invalidated and the trade was dead. No averaging down. No “it’ll come back.” Dead.
Lessons Learned: What This Trade Teaches
1. Confluence beats conviction
A single indicator is a guess. Four independent systems agreeing on the same zone is a trade. The Square of 9 gave us 4,132. The Fibonacci gave us 4,128.3. The RSI gave us exhaustion. The Venus Rx gave us regime context. Any one alone would have been weak. Together, they were the trade.
2. Retrogrades are regime signals, not stop signs
The biggest mistake retail traders make with astrology is treating retrograde planets as “don’t trade” windows. Wrong. Venus Rx doesn’t mean the market stops — it means the character of price action shifts. Mean-reversion setups get an edge. Breakout setups get discounted. On October 7–8, the mean-reversion setup was the flush into support. We traded it.
3. The Square of 9 works because enough people watch it
Is there a mystical reason gold bounced at 4,091.2? Maybe. But the practical reason is that thousands of Gann traders had the 4,070–4,132 band on their charts. Self-fulfilling prophecy is still a prophecy. The geometry matters because the crowd believes it matters.
4. Position sizing is the only variable you fully control
You don’t control whether the trade wins. You control how much you lose if it doesn’t. The 0.8% risk model exists so that a string of five losses costs you 4% — annoying, survivable, forgettable. A trader risking 5% per trade hits a five-loss streak and loses 22.6% of their account. That’s how careers end.
5. Confirm, don’t predict
We did not buy at 4,091.2. We bought at 4,132.0 — 40 points higher — because that’s where the market proved the level held. Yes, we gave up 40 points of potential profit. In exchange, we got a defined invalidation level (4,088.0) and a clean R:R. Prediction is gambling. Confirmation is trading.
The Framework, Condensed
If you want to run this playbook yourself, here’s the checklist:
- Identify the swing anchor (high or low) and run the Square of 9 rotations down/up to map support/resistance nodes.
- Overlay Fibonacci on the most recent impulse leg. Look for 61.8%, 78.6%, and 127.2–161.8% extensions.
- Check the Vedic ephemeris for retrograde planets and nakshatra transits relevant to the asset. Venus Rx → gold mean-reversion. Mercury Rx → choppy ranges. Saturn Rx → compressed breakouts.
- Wait for RSI or MACD divergence confirming momentum exhaustion at the confluence zone.
- Enter only on a reclaim of the key Square of 9 node. Stop goes below the swing extreme with a small buffer.
- Size the position using fixed-fractional risk — 0.5–1% per trade for volatile assets like gold.
- Scale out: 60% at Target 1, trail the rest.
That’s the entire system. No black box. No secret indicator. Just geometry, timing, and discipline.
Want the Full QuantEA Framework?
This breakdown is one trade out of dozens we document every quarter. The QuantEA Labs system runs the Square of 9, Fibonacci, Vedic transit timing, and momentum confirmation as a single automated scan — surfacing confluence zones before the session opens, with pre-calculated entry, stop, and target levels.
If you want to see the exact scanner that flagged the 4,132 gold reclaim 18 hours before it triggered, join the QuantEA Labs research desk. You’ll get the daily confluence map, the planetary timing calendar, and the full risk-management toolkit we use to size every position.
The market gives you the geometry every day. The question is whether you’re watching for it.
— Kim Ssa, QuantEA Labs