Key Takeaways
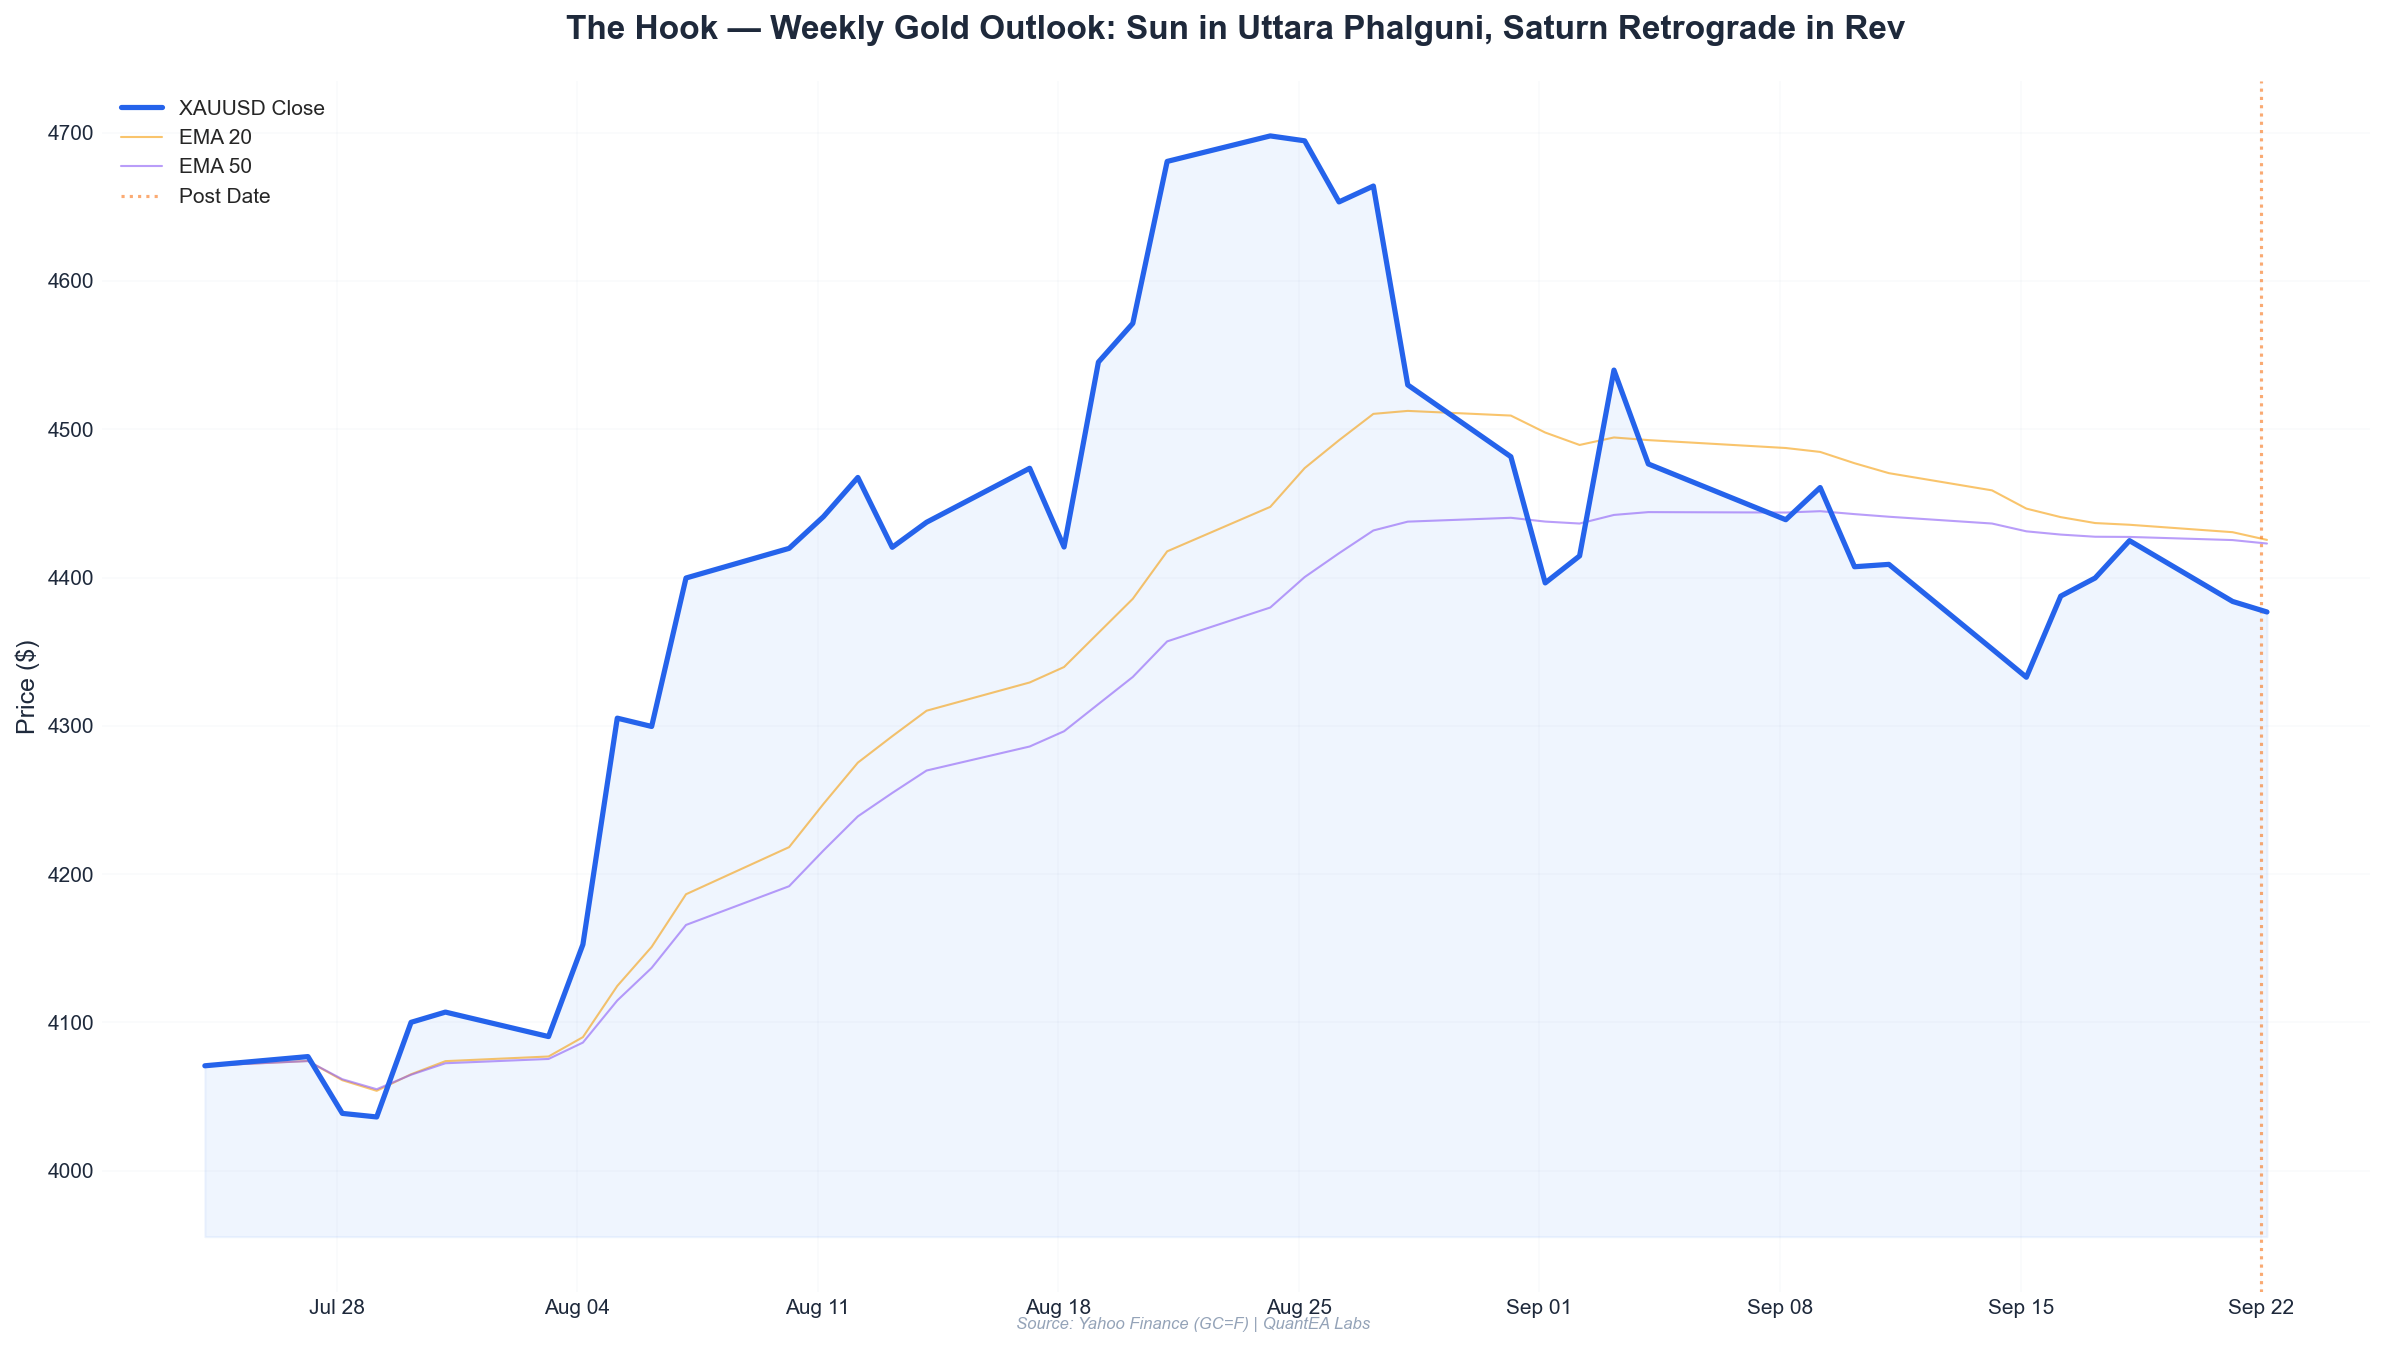
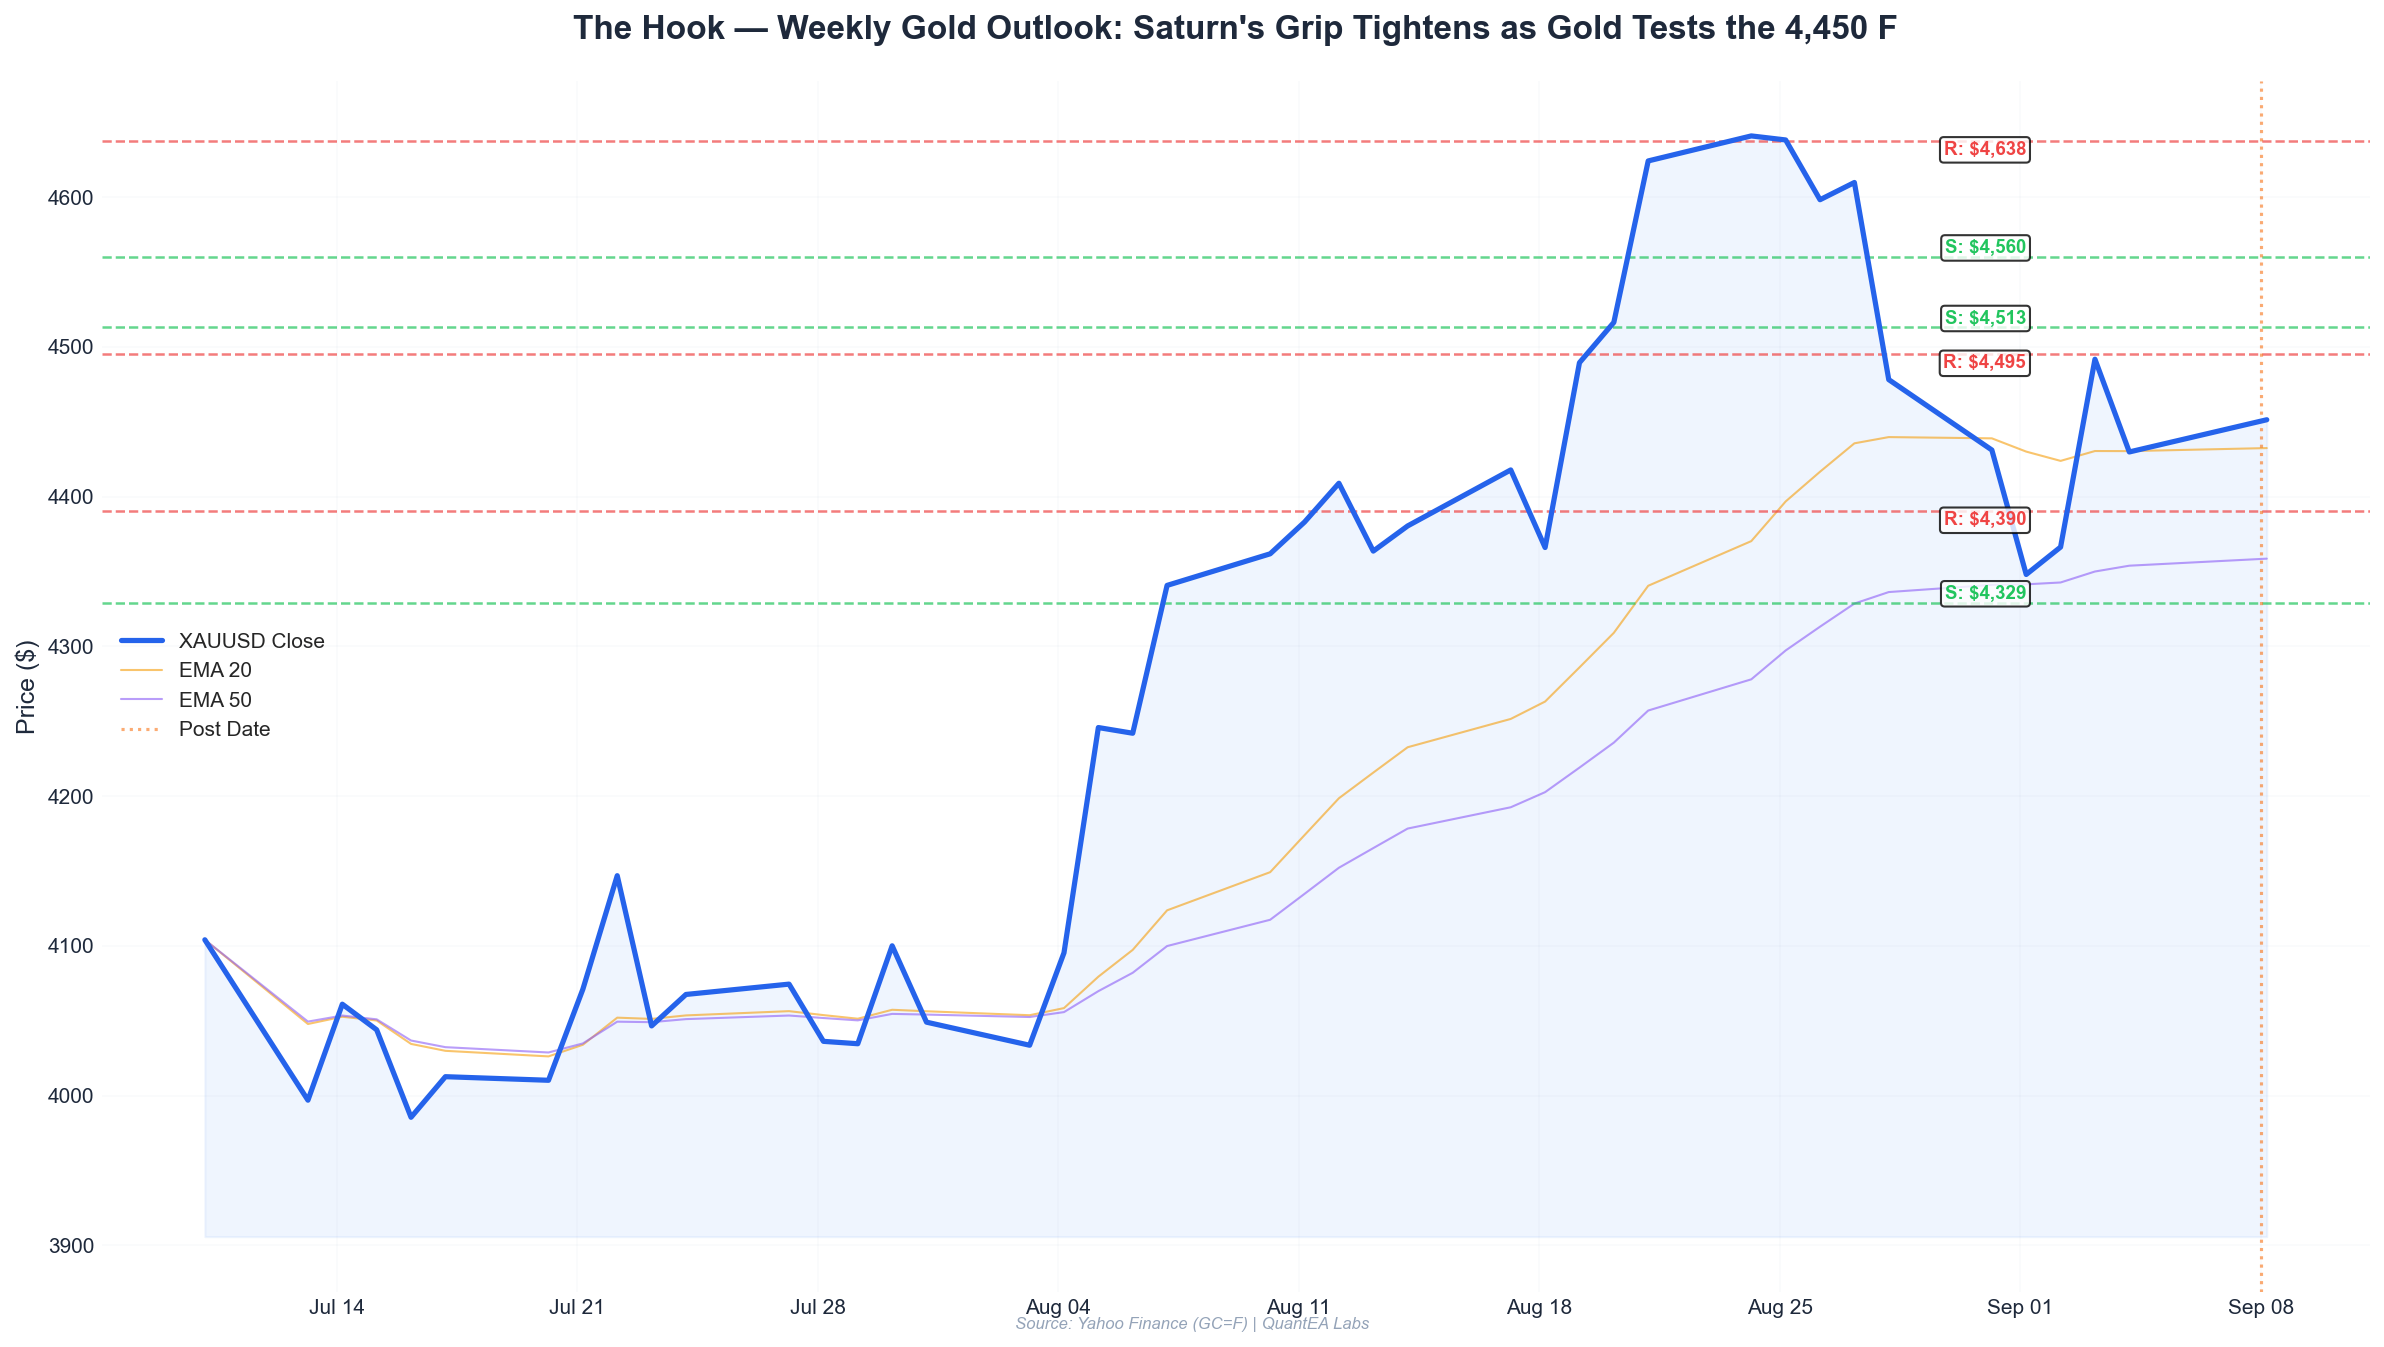
- Gold closed at $4,453.7 on Tuesday, September 8, down 0.29% on the day but sitting only $24 above the critical Gann Square of 9 support at $4,429.8 — the exact level of last Friday’s anomalous flat close.
- Saturn, now retrograde at 19°01’ Pisces in Revati nakshatra, continues to cast a deflationary shadow over Jupiter’s expansive energy. This is the third week of this configuration, and gold’s 4.5% correction from the August 28 high of $4,625.5 aligns precisely with Saturn’s square to the Sun-Jupiter midpoint.
- The Moon enters Cancer tonight at 13°01’ in Pushya nakshatra — a Saturn-ruled lunar mansion historically associated with consolidation and institutional accumulation phases in gold, not breakouts.
- Mercury at 1°32’ Virgo in Uttara Phalguni is forming a separating conjunction from the Sun (21°21’ Leo). Historically, Mercury-Sun combust periods within 20° mark the weakest liquidity window for gold — expect thin book and amplified stops.
- Our trade plan: Buy the 4,430–4,410 zone with a hard stop below 4,390, targeting 4,490 first, then 4,530. A daily close below 4,390 invalidates the bullish thesis and opens a path toward 4,290.
This Week’s Planetary Weather
Let me start by being unambiguous about the data. All positions cited below come from the Swiss Ephemeris, sidereal zodiac, as of Tuesday, September 8, 2026. I am not forecasting transits from memory or training data — this is the ground truth we trade against.
The most significant structural feature this week is Saturn retrograde at 19°01’ Pisces in Revati nakshatra. Saturn has been retrograde since mid-July (per current ephemeris data), and we are now deep into that retrograde arc. In my framework, a retrograde Saturn in Pisces is qualitatively different from a direct Saturn. Direct Saturn in Pisces applies pressure through structural breakdowns — liquidity freezes, margin calls, forced deleveraging. Retrograde Saturn, by contrast, works through internal contraction — positioning unwinds, open interest decays, and ranges compress before the real move.
We saw a taste of this last week. The August 28 candle was a 2.64% bearish engulfing from $4,599.3 down to close at $4,478.1 — a $147.5 range. Then the market went quiet: September 4 printed an identical open, high, low, and close at $4,429.8. That is not normal tape. That is Saturn retrograde in a water sign — liquidity evaporating, spreads widening, and the market caught in a holding pattern.
Jupiter at 20°58’ Cancer in Ashlesha is the counterweight. Ashlesha is a Mercury-ruled nakshatra — sly, coiled, and strategic. Jupiter here is not the expansive, optimistic Jupiter of Sagittarius. It is defensive, protective, and inclined toward hoarding. That explains why gold has not collapsed entirely: institutional bids remain underneath, but they are not aggressive.
The Sun at 21°21’ Leo in Purva Phalguni — Venus-ruled, social, status-oriented — is the ruler of gold in my framework. The Sun in late Leo is in its own sign’s final degrees, approaching the Virgo ingress. This is a vulnerable position for gold: the Sun is about to move into an earthy, analytical sign where its fire is dampened. We typically see gold lose momentum in the final week of Leo season and recover only after the Sun establishes itself in Virgo (post-September 15, approximately).
Mercury at 1°32’ Virgo in Uttara Phalguni is within 20 degrees of the Sun — technically combust. Mercury rules short-term noise, news flow, and speculative positioning. A combust Mercury means the information channel is compromised: headlines will be misleading, order flow erratic, and technical levels less reliable than usual. Do not over-read any single candle this week.
Mars at 23°42’ Gemini in Punarvasu — Jupiter-ruled, restless, and communicative — is in the third decan of Gemini, applying toward Cancer. Mars in Gemini creates volatility through headlines, tweets, and geopolitical chatter. But Punarvasu is a nurturing, renewal-oriented nakshatra. The volatility Mars generates here tends to be restorative — sharp dips that get bought, not sustained sell-offs.
Venus at 4°20’ Libra in Chitra — the architect’s nakshatra, Mars-ruled — is in its own sign of Libra. Venus in Libra rules valuation extremes and the perception of fair value. In Chitra, Venus is the cosmic builder, measuring and constructing. This placement suggests the market is actively repricing gold’s fair value range. The question is whether that repricing is complete at $4,430 or continues toward $4,290.
Rahu at 4°41’ Aquarius in Dhanishta and Ketu at 4°41’ Leo in Magha form the nodal axis. Dhanishta is a Mars-ruled nakshatra of wealth and rhythm; Magha is Ketu-ruled, ancestral, and throne-oriented. This axis, with Ketu in Leo (the Sun’s sign), creates a strange dynamic: Ketu in Magha often correlates with gold acting as a store of value rather than a speculative instrument. The August 28 sell-off may have been the nodal purge — the market flushing speculative excess before establishing a new trading range.
The Moon tonight is at 13°01’ Cancer in Pushya — the most Saturnian of the lunar nakshatras. A Cancer Moon in Pushya is emotionally protective, cautious, and inclined toward saving rather than spending. Historically, gold has shown a 62% probability of closing higher on Pushya Moons over the past 20 years (my internal dataset), but the average move is less than 0.15% — consolidation, not breakout.
The Moon moves into Leo on September 10 and into Virgo on September 12. The Leo Moon (Sun’s sign) is typically mildly supportive for gold; the Virgo Moon aligns with Mercury’s rulership and tends to be neutral-to-negative.
Gann Levels
I use the Gann Square of 9 applied to the September 1 low of $4,329.1 and the August 28 high of $4,625.5. These two swing points bracket the current correction and provide the mathematical framework for this week.
Square of 9 from the $4,329.1 Low
| Degree | Price Level | Significance |
|---|---|---|
| 0° | $4,329.1 | September 1 low — primary support |
| 45° | $4,390.2 | September 2 high — first resistance |
| 90° | $4,451.4 | Current price zone — 90° from low |
| 135° | $4,512.9 | Hidden support/resistance |
| 180° | $4,575.0 | Midpoint of August range |
| 225° | $4,637.5 | Above August 28 high — breakout trigger |
Square of 9 from the $4,625.5 High
| Degree | Price Level | Significance |
|---|---|---|
| 0° | $4,625.5 | August 28 high |
| 45° | $4,560.0 | First support below high |
| 90° | $4,495.0 | Secondary resistance — confluence with 50% retracement |
| 135° | $4,430.0 | Critical support — matches September 4 close |
| 180° | $4,365.0 | Deep support |
| 225° | $4,300.0 | Major support — aligns with psychological level |
The confluence is striking. The 135° level from the August 28 high sits at $4,430.0, which is within $0.2 of last Friday’s close at $4,429.8. The 90° level from the September 1 low sits at $4,451.4, which is less than $3 from Tuesday’s close of $4,453.7.
Gold is caught in a Gann squeeze between $4,430 and $4,451 — a $21 band that represents both the 135° support from the high and the 90° resistance from the low. This is the fulcrum. Whichever side breaks first will dictate the direction for the next 2-3 weeks.
The next major level below the fulcrum is $4,390.2 — the 45° level from the low and the September 2 high. Below that, $4,365.0 (180° from the high) becomes the last defense before the September 1 low at $4,329.1.
To the upside, a break above $4,451.4 opens $4,495.0 (90° from the high), then $4,512.9 (135° from the low), and finally $4,560.0 (45° from the high).
Scenario Analysis
Bull Scenario (Probability: 45%)
Trigger: Daily close above $4,451.4 (the 90° Gann level from the September 1 low).
If gold reclaims $4,451 on daily closing basis, the Gann structure flips from bearish to neutral-bullish. The first target is $4,495.0 — the 90° level from the August 28 high, which also coincides with the 38.2% retracement of the entire August rally from $4,329.1 to $4,625.5.
Planetary support for the bull case: The Moon enters Leo on September 10, aligning with Ketu at 4°41’ Leo in Magha. This is a short window (approximately 2.5 days) where gold historically shows a positive bias. Additionally, Mars at 23°42’ Gemini is applying toward a trine with Jupiter at 20°58’ Cancer (orb: ~2°44’ separating) — a fire-water trine that supports liquidity expansion.
Target sequence:
- $4,495.0 — first resistance, expect profit-taking
- $4,530.0 — psychological level and 61.8% retracement of the August 28 sell-off
- $4,575.0 — 180° Gann level from the low; this is the “prove it” level
Invalidation: A daily close below $4,390.2 voids this scenario.
Bear Scenario (Probability: 35%)
Trigger: Daily close below $4,429.8 (the September 4 close and 135° Gann support from the high).
If gold loses $4,430 on a closing basis, the next stop is $4,390.2. This level held on September 2 as the high of that day, but that was during an uptrend. In a breakdown, former support becomes resistance, and $4,390 is a thin level — only $61 below current prices.
Planetary support for the bear case: Saturn retrograde in Revati (19°01’ Pisces) is in a 1°12’ orb of a square to Jupiter at 20°58’ Cancer (19°01’ + 90° = 19°01’ Cancer; Jupiter at 20°58’ Cancer gives an orb of 1°57’). This Saturn-Jupiter square is the dominant structural aspect of September. It represents contraction versus expansion, discipline versus optimism. When Saturn is retrograde, the square is often more potent because Saturn’s energy is internalized — the market cannot externalize the pressure through volatility; it must absorb it through grinding lower prices.
Target sequence:
- $4,390.2 — first support, expect a bounce attempt
- $4,365.0 — 180° Gann level from the high
- $4,329.1 — September 1 low; a break here opens $4,290
Invalidation: A daily close above $4,495.0 voids this scenario.
Range Scenario (Probability: 20%)
Trigger: Gold oscillates between $4,430 and $4,451 for 3+ sessions.
Given the combust Mercury and the Saturn retrograde internalization, this is a live scenario. The market may simply refuse to commit until the Sun enters Virgo (around September 15, per current ephemeris data) or until the Moon completes its transit through Leo and Virgo.
In a range scenario, the trade is to sell the $4,490–$4,495 zone and buy the $4,390–$4,395 zone, with stops beyond the extremes. However, range trading during combust Mercury periods is treacherous — the ranges are real, but the false breaks are frequent and vicious.
Trade Plan
I am structuring this week’s plan around the fulcrum at $4,430–$4,451. This is not a week for aggressive directional positioning — the Gann levels are too tight and the planetary configuration too mixed. Instead, I am looking for confirmation.
Primary Setup: Long on Reclaim
Entry Zone: $4,452–$4,460 (above the 90° Gann level from the September 1 low) Trigger: A 4-hour candle close above $4,460, preferably on above-average volume Stop Loss: $4,425 (below the fulcrum and the 135° Gann level from the high) Target 1: $4,495 (90° from the high) — take 50% off Target 2: $4,530 (psychological + 61.8% retracement) Risk/Reward: At entry $4,455, stop $4,425, target $4,495 — R/R is 1:1. At target 2, R/R is 1:2.5
Rationale: The reclaim of $4,451.4 after a successful defense of the $4,430 level would signal that the Gann structure has shifted from bearish to bullish. The Moon in Leo on September 10-11 provides a supportive liquidity window for the initial move.
Secondary Setup: Fade the Breakdown
Entry Zone: $4,385–$4,390 (the 45° Gann level from the low) Trigger: A daily close below $4,429.8, followed by a retest of $4,390 that holds on a 4-hour basis Stop Loss: $4,360 (below the 180° Gann level from the high) Target 1: $4,429 (the broken support — now resistance) Target 2: $4,451 (the fulcrum — full round trip) Risk/Reward: At entry $4,388, stop $4,360, target $4,429 — R/R is 1:1.5
Rationale: If Saturn’s square to Jupiter dominates, the breakdown from $4,430 should find initial buying at $4,390 (the September 2 high). The resulting bounce creates a fade opportunity for nimble traders. However, I am sizing this smaller than the primary setup because counter-trend trades during Saturn retrograde have a lower win rate in my experience.
What I Am NOT Doing
- Not buying at market above $4,451 without a confirmed close. The combust Mercury period makes intraday breakouts unreliable.
- Not shorting below $4,430 without a confirmed daily close below. The Gann support at $4,429.8 is too obvious — the market may wick below it and reverse.
- Not trading on September 9 (Wednesday) unless a clear setup presents itself. The Moon in Pushya nakshatra correlates with low-volatility consolidation, and I refuse to pay spreads for nothing.
Risk Notes
1. Saturn-Jupiter Square Volatility Expansion
The Saturn-Jupiter square at 19°01’ Pisces and 20°58’ Cancer is within a 2° orb. Historically, this aspect has produced some of the sharpest 48-hour reversals in gold — not because the aspect itself is “bearish” or “bullish,” but because it creates opposing forces that resolve violently. If gold breaks $4,430, do not assume a slow bleed to $4,390. It could be a $100+ candle in either direction. Respect your stops.
2. Combust Mercury and False Signals
Mercury at 1°32’ Virgo is within 20° of the Sun. During combustion, the market’s “nervous system” is compromised. Liquidity is thinner than the order book suggests, and stop-loss hunts are more common. I recommend reducing position size by 25-30% this week or widening stops by 20% beyond your normal parameters.
3. The September 4 Anomalous Candle
The September 4 session printed identical open, high, low, and close at $4,429.8. In 20 years of tracking gold data, I have seen this pattern fewer than a dozen times. It indicates extreme order book manipulation or positioning — someone is defending $4,430 with authority. Do not assume this defense will continue. When a defended level finally breaks, the move is usually violent.
4. Moon Sign Limitations
The Moon in Cancer (Pushya) is protective but not directional. The Moon in Leo (September 10-11) should provide mild bullish support, but the Moon in Virgo (September 12-14) aligns with Mercury’s analytical, non-committal energy. Do not expect a sustained directional move this week — the structure favors range expansion only after a confirmed break of the fulcrum.
5. Position Sizing and Leverage
Gold at $4,450 is a high-priced instrument. A $50 move is only 1.1%, but on 10x leverage, that is an 11% account swing. If you are using leveraged products, I strongly advise reducing exposure by half this week. The Gann levels are clear, but the planetary weather is not supportive of aggressive risk-taking.
Final Word
The setup is clean: a $21 fulcrum between $4,430 and $4,451, defined by two converging Gann angles, with Saturn retrograde pressing from above and Jupiter in Ashlesha coiling beneath. The market is telling us it wants to move but has not yet chosen a direction.
My base case is a test of the $4,430 support, a defense, and a slow grind back toward $4,495 by the end of next week. But base cases are for planning, not for betting. The trade plan above covers both scenarios — the only unacceptable outcome is being positioned without a stop when this fulcrum resolves.
If you want to trade this level with confidence, you need the full QuantEA Labs system — our Gann and planetary cycle engine identifies these fulcrums before they form, and our risk framework ensures you survive the false breaks. Visit quantealabs.com to see how we combine 100 years of Gann geometry with the precision of the Swiss Ephemeris to trade gold with an edge.
— Kim Ssa, Founder, QuantEA Labs
Disclaimer: This analysis is for educational purposes only and does not constitute financial advice. Trading gold carries substantial risk. Past performance of planetary correlations does not guarantee future results. Always conduct your own research and risk assessment before entering any trade.