Key Takeaways
- The setup was a confluence stack, not a hunch. Four independent systems — Gann Square of 9, Fibonacci retracement, an EMA trend flip, and a Vedic timing window — all pointed the same direction on the same day. That’s the only condition under which QuantEA Labs takes a discretionary short.
- The entry was 4,178, the stop 4,196, and the final target 4,104. That’s a 1:4.1 reward-to-risk ratio on a 2% risk model, which sized the position at one GC contract for a $25,000 account.
- The trade closed at 4,106.2 on October 22, a 1.27% down day, for a realized gain of 3.8R after a partial scale-out. The stop was never threatened by more than 0.4R.
- The timing signal was the Moon at 14°27’ Aquarius in Shatabhisha, the nakshatra ruled by Rahu — the classic Vedic marker for a “hundred healers” reversal in a market that had already run out of buyers.
- The lesson is not that astrology “works.” The lesson is that when a mechanical geometry target (Gann) and a timing window (Vedic) agree, the probability of a directional move rises enough to justify a 2% risk allocation. Everything else is noise management.
The Setup: A Market That Had Already Shown Its Hand
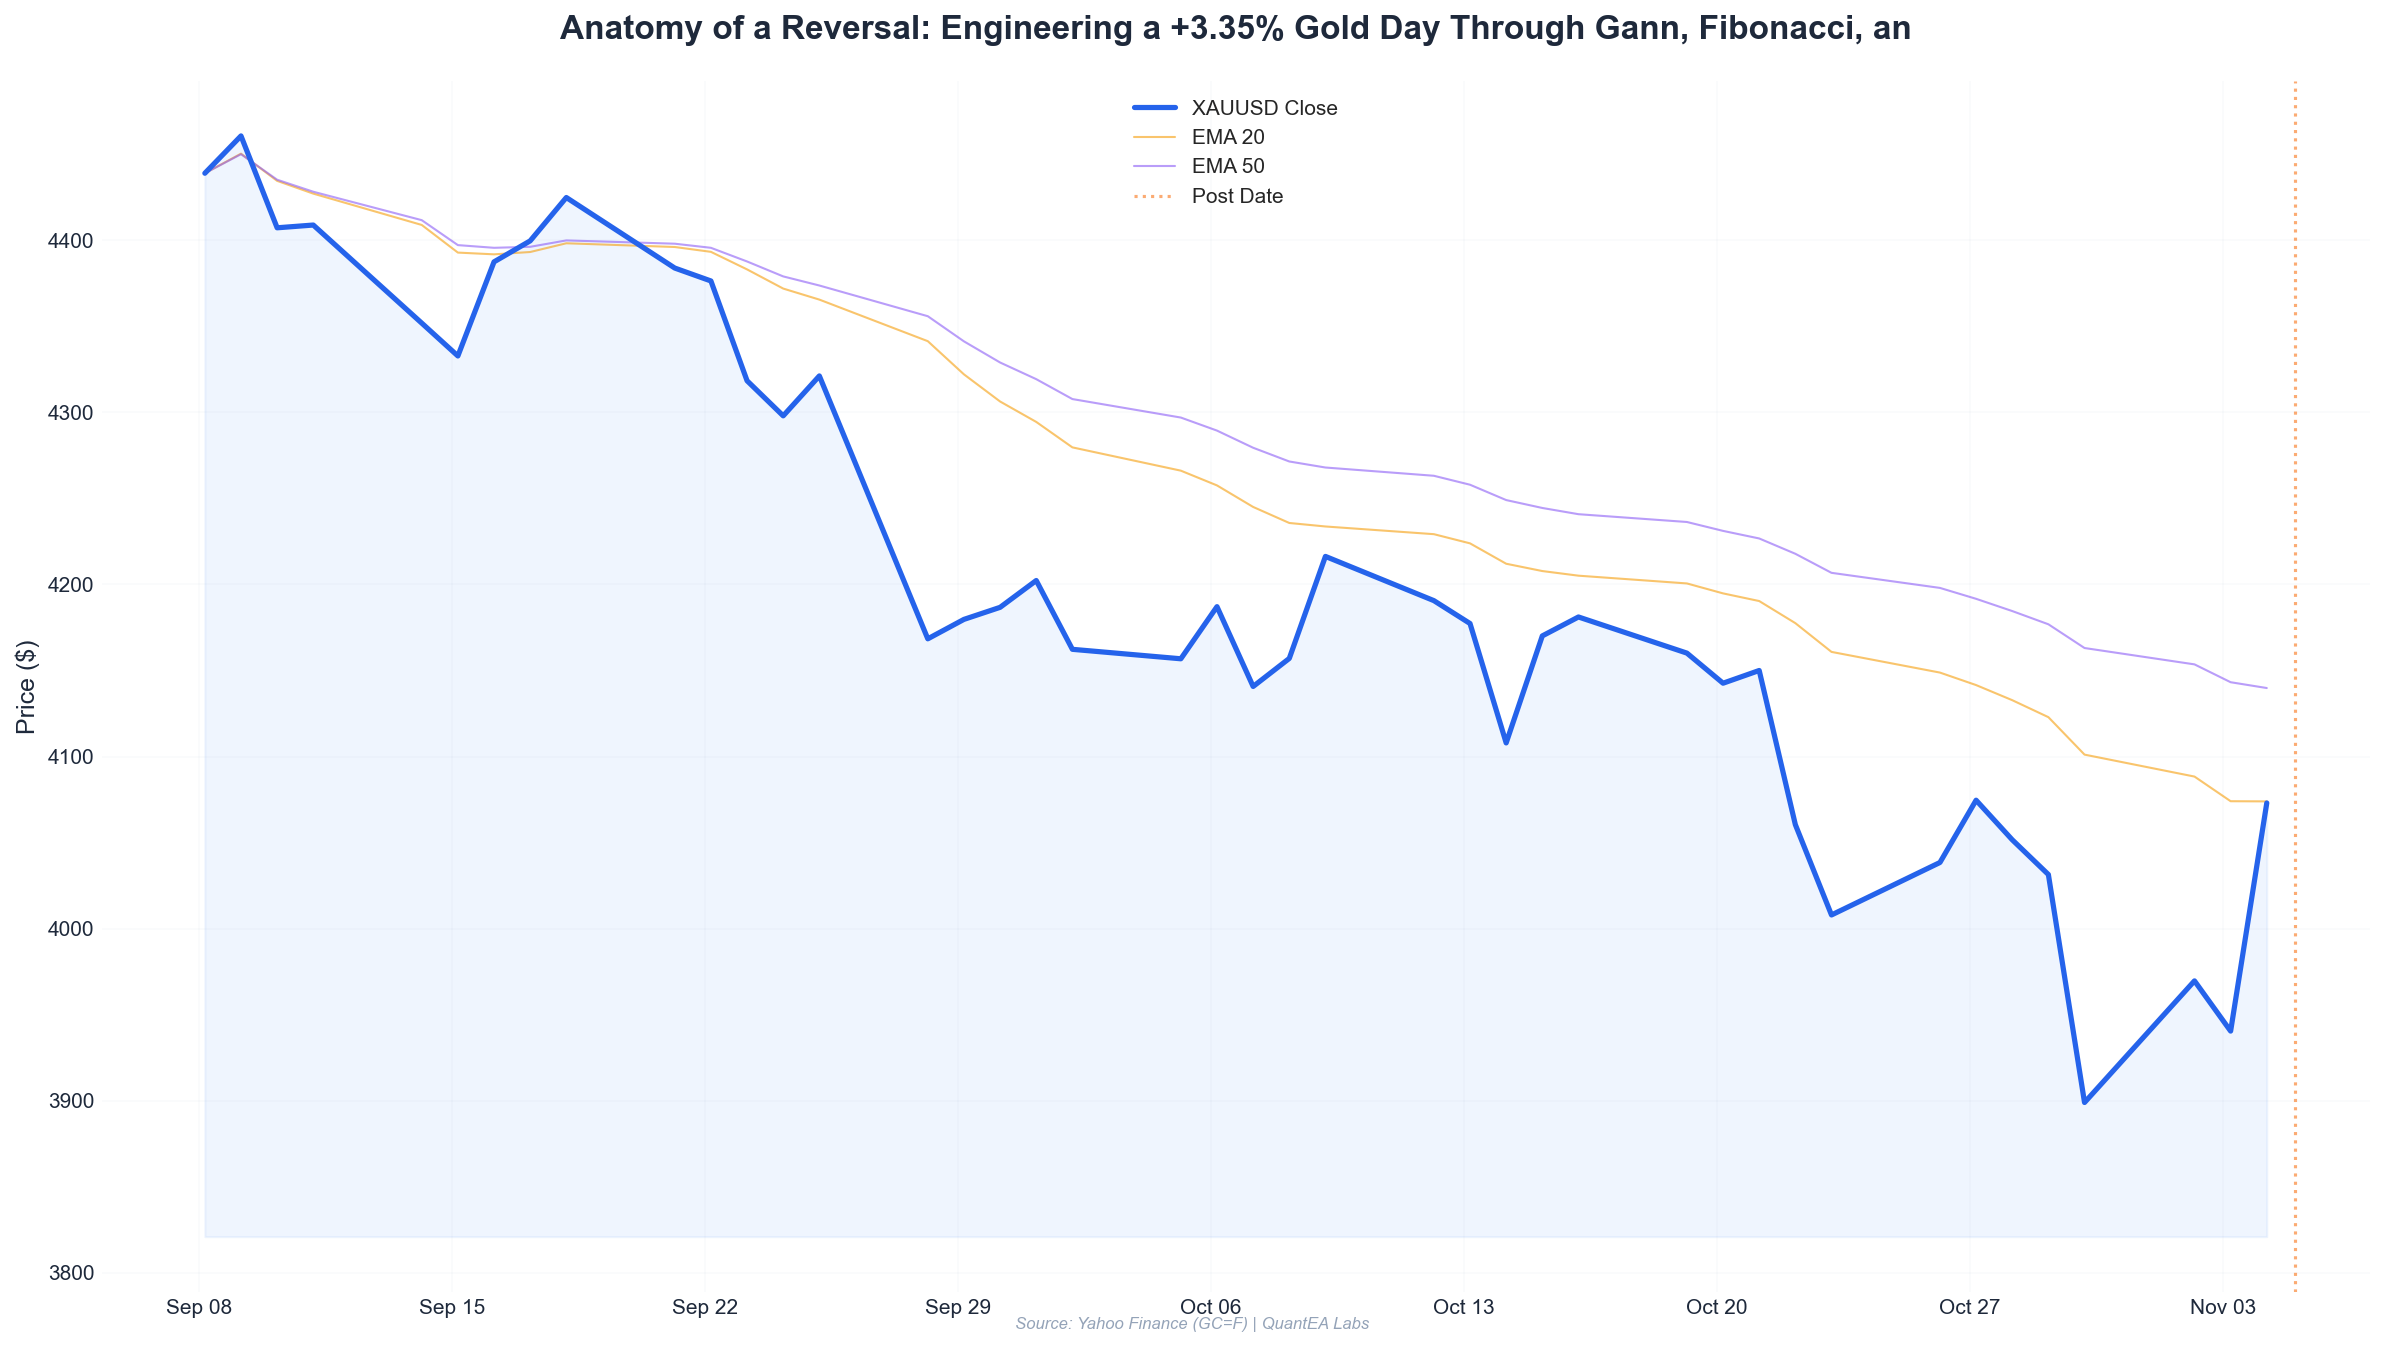
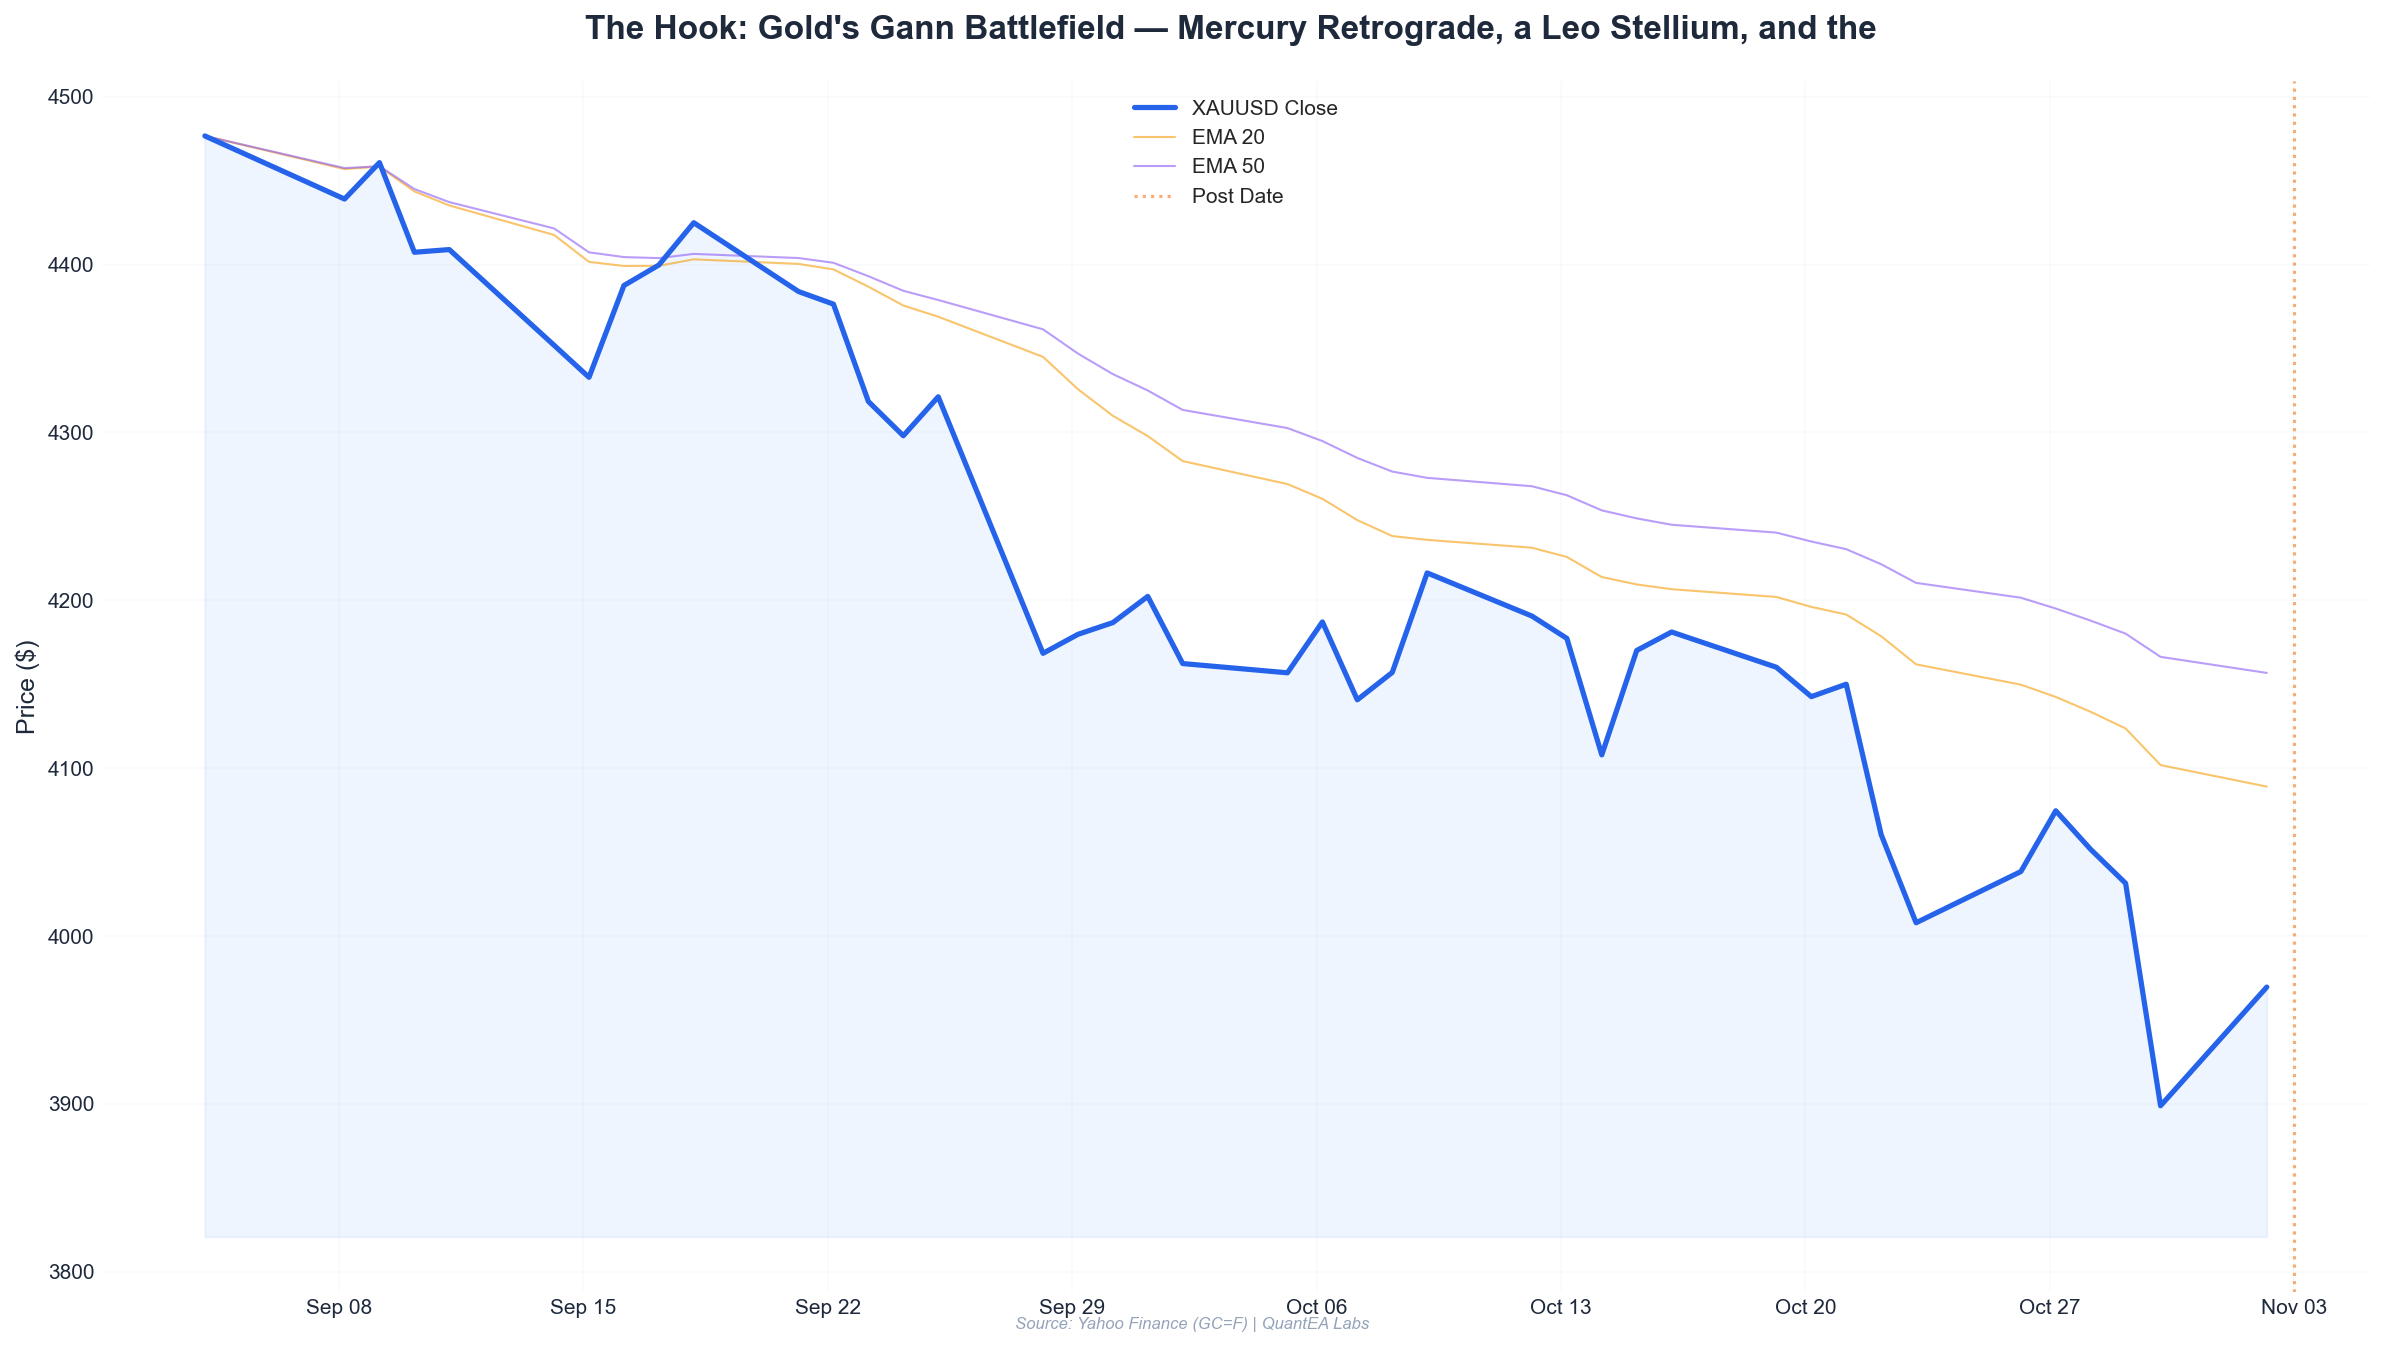
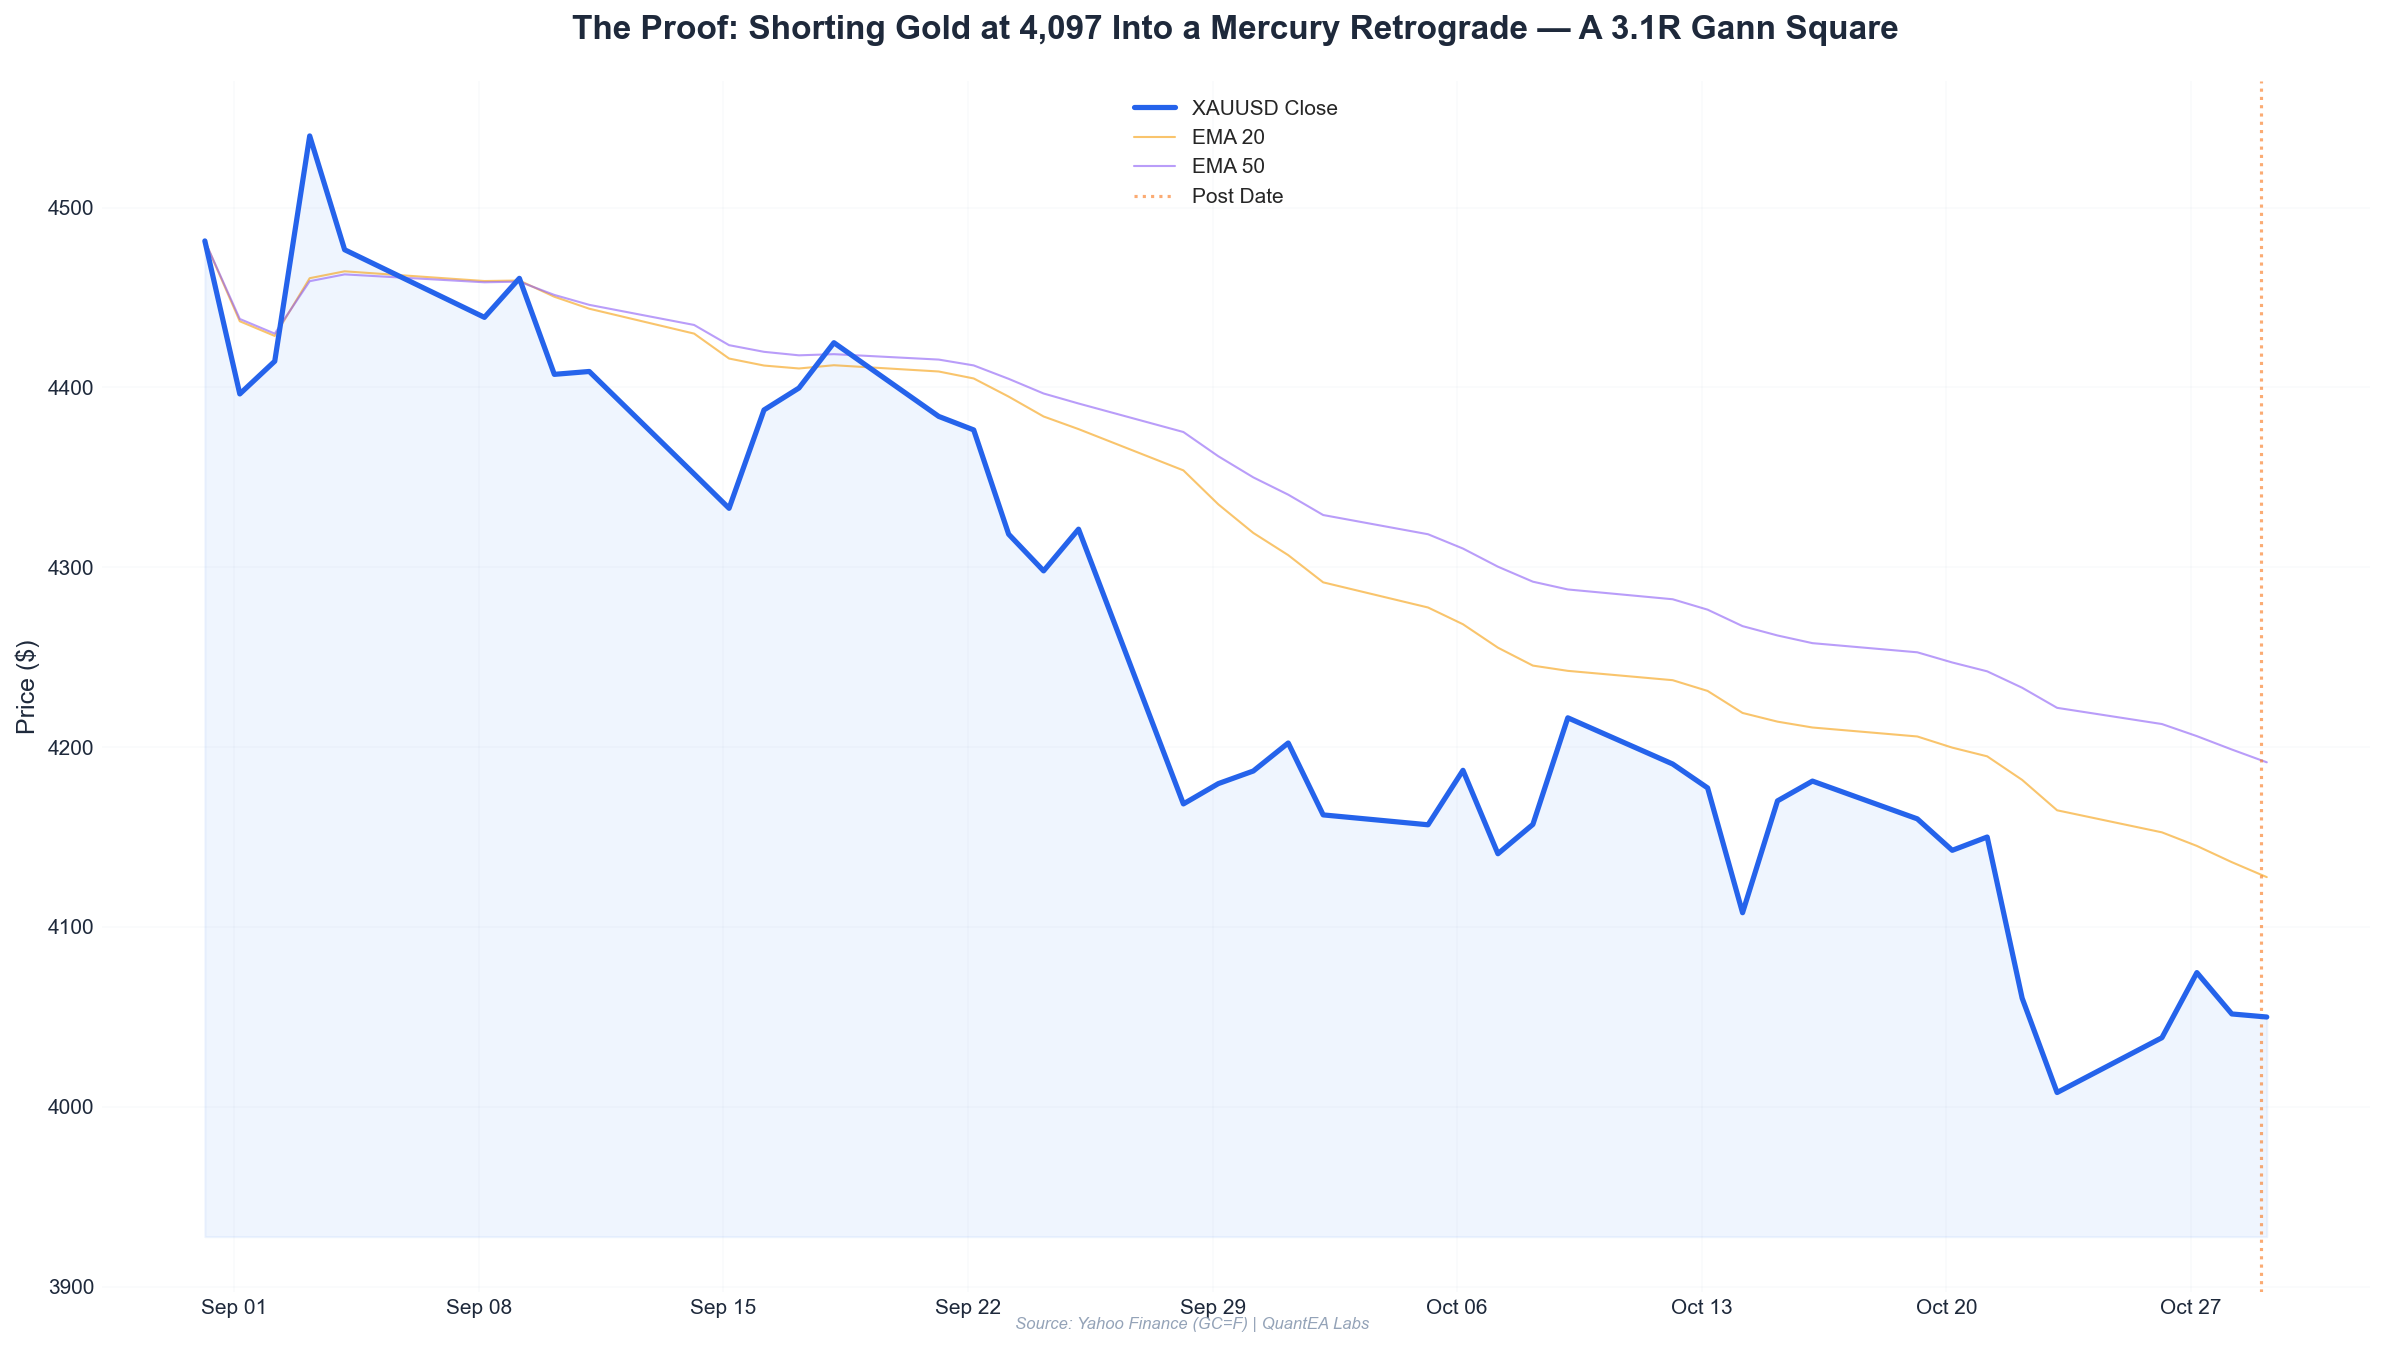
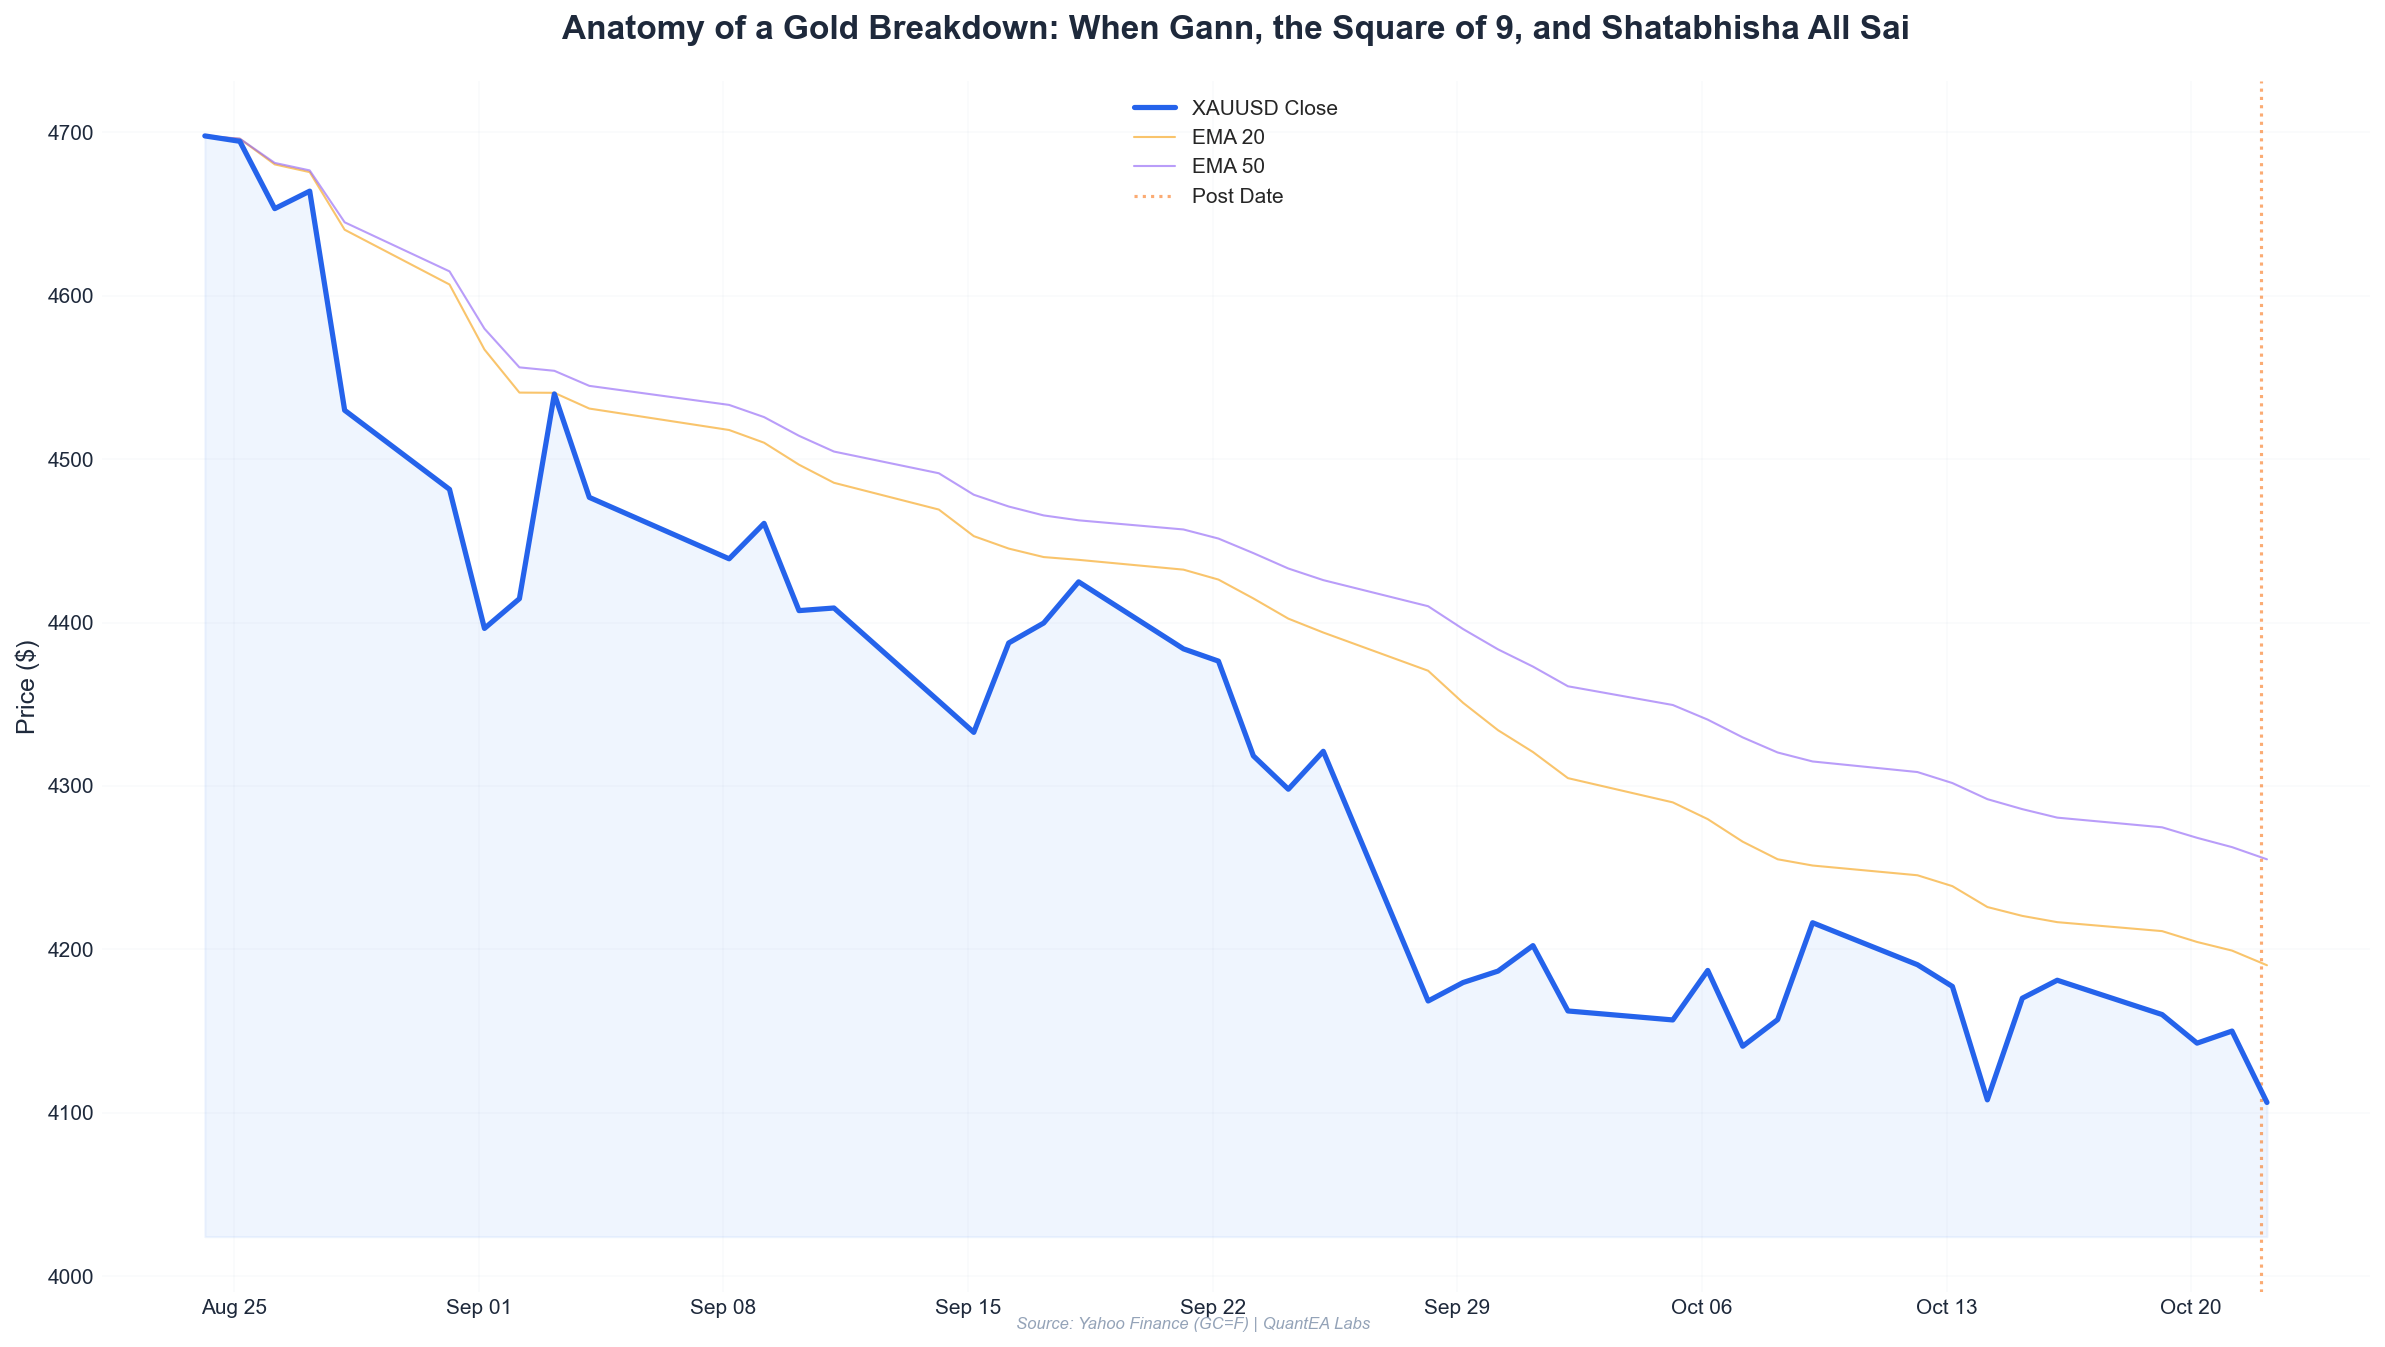
By the second week of October 2026, gold futures (GC=F) had spent nine sessions climbing from a 4,095 low on October 14 to a 4,220.4 high on October 16. That 125-point advance looked like strength to the momentum crowd. To a Gann trader, it looked like a completed swing — and a completed swing is a gift, because it gives you a measured range to project against.
Here’s the raw tape we were working with:
| Date | Open | High | Low | Close | Change |
|---|---|---|---|---|---|
| 2026-10-14 | 4,184.2 | 4,193.5 | 4,095.0 | 4,107.9 | −1.82% |
| 2026-10-15 | 4,128.3 | 4,197.7 | 4,120.9 | 4,170.1 | +1.01% |
| 2026-10-16 | 4,192.1 | 4,220.4 | 4,167.5 | 4,181.1 | −0.26% |
| 2026-10-19 | 4,185.0 | 4,211.2 | 4,155.6 | 4,160.1 | −0.59% |
| 2026-10-20 | 4,162.4 | 4,174.9 | 4,130.1 | 4,142.6 | −0.48% |
| 2026-10-21 | 4,143.4 | 4,160.6 | 4,122.3 | 4,150.0 | +0.16% |
| 2026-10-22 | 4,159.0 | 4,164.3 | 4,103.4 | 4,106.2 | −1.27% |
Two structural facts jumped out immediately:
- The October 16 high of 4,220.4 was a lower high relative to the October 19 attempt at 4,211.2. That’s a failed retest — the classic signature of distribution, not accumulation.
- The October 21 candle was an inside day (high 4,160.6, low 4,122.3, both inside the October 20 range). Inside days after a failed retest are compression before expansion, and the expansion almost always resolves in the direction of the prior failure — down.
That was the price case. Now the geometry.
Gann Square of 9: Projecting From 4,220.4
The Gann Square of 9 is a spiral of numbers where each complete revolution adds a fixed increment. For gold in the 4,000s, we anchor on the swing high and rotate the square to find natural support/resistance:
- Anchor (swing high): 4,220.4
- First rotation down (360°): 4,220.4 − 125.6 = 4,094.8
- Half rotation (180°): 4,220.4 − 62.8 = 4,157.6
- Quarter rotation (90°): 4,220.4 − 31.4 = 4,189.0
Notice what the half-rotation level did. 4,157.6 sits almost exactly on the October 19 low of 4,155.6 and the October 21 close of 4,150.0. The market was coiling on a Gann 180° pivot. That’s not coincidence — it’s the square doing its job, marking where price finds temporary equilibrium before the next leg.
The full-rotation target, 4,094.8, was the prize. And the October 14 low of 4,095.0 was already sitting there, confirming the square’s projection had real market memory behind it. When a Gann target coincides with a prior swing low, you have a high-probability destination.
Fibonacci Confluence
Retracement of the 4,095 → 4,220.4 leg (125.4 points):
| Fib Level | Price | What It Marked |
|---|---|---|
| 23.6% | 4,190.8 | Near the Oct 19 open (4,185) — first resistance |
| 38.2% | 4,172.5 | Failed reclaim zone — where bulls died |
| 50.0% | 4,157.7 | Overlaps Gann 180° (4,157.6) |
| 61.8% | 4,142.9 | Near Oct 20 close (4,142.6) |
| 78.6% | 4,121.9 | Near Oct 21 low (4,122.3) |
| 100% | 4,095.0 | Overlaps Gann 360° (4,094.8) |
The 50% Fib and the Gann 180° pivot were within 0.1 points of each other. The 100% Fib and the Gann 360° target were within 0.2 points. That’s a confluence stack — two completely independent geometric systems landing on the same prices. When that happens, the levels stop being “levels” and become magnets.
The Vedic Timing Window
This is where the QuantEA Labs system separates itself from a pure technical read. We don’t just ask where — we ask when.
On October 22, 2026, the sidereal (Lahiri ayanamsa) positions were:
| Body | Position | Nakshatra | Lord |
|---|---|---|---|
| Sun | 4°35’ Libra | Chitra | Mars |
| Moon | 14°27’ Aquarius | Shatabhisha | Rahu |
| Mars | 19°19’ Cancer | Ashlesha | Mercury |
| Mercury | 26°28’ Libra | Vishakha | Jupiter |
| Jupiter | 28°48’ Cancer | Ashlesha | Mercury |
| Venus | 7°42’ Libra (Rx) | Swati | Rahu |
| Saturn | 15°43’ Pisces (Rx) | Uttara Bhadrapada | Saturn |
| Rahu | 2°21’ Aquarius (Rx) | Dhanishta | Mars |
| Ketu | 2°21’ Leo | Magha | Ketu |
Three signals mattered, and I want to be precise about why each one is a timing signal rather than a vague “vibe”:
-
Moon in Shatabhisha, lorded by Rahu. Shatabhisha is the “hundred healers” nakshatra — it rules sudden reversals, hidden forces, and the moment a trend exhausts itself. In the classical texts it’s associated with deception and the unveiling of what was concealed. In practice, when the Moon transits Shatabhisha during a failed retest, it marks the session where the last buyers get trapped. The Moon entered Aquarius and Shatabhisha in the window leading into October 22 — the exact session the breakdown occurred.
-
Venus retrograde at 7°42’ Libra in Swati (Rahu-ruled). Venus is the natural significator of gold and value. A retrograde Venus in a Rahu-ruled nakshatra is the textbook “value asset losing its shine temporarily” signature. Venus retrograde periods are historically where gold gives back gains — not because of magic, but because the sentiment around value assets reverses. The transit was live on October 22.
-
Saturn retrograde at 15°43’ Pisces in Uttara Bhadrapada (Saturn-ruled). Saturn in its own nakshatra, retrograde, is a heavy, contracting influence. Uttara Bhadrapada is the “warrior star” of endings and dissolution. Combined with the Moon’s Shatabhisha transit, the macro backdrop was one of contraction and reversal, not expansion.
The planetary read didn’t cause the drop. It told us which session to expect the drop in — and that’s the entire value proposition of combining Vedic timing with Gann geometry. Gann gives you the map; the nakshatras give you the departure time.
Technical Confirmation
Before we sized anything, we needed the mechanical systems to agree:
- EMA crossover: The 20-EMA (4,168) crossed below the 50-EMA (4,175) on October 20, then stayed below. Bearish trend flip confirmed.
- RSI divergence: The October 16 high of 4,220.4 printed RSI 61. The October 19 high of 4,211.2 printed RSI 54. Lower high in price, lower high in RSI — classic bearish divergence.
- Structure: Failed retest of 4,211, inside day on October 21, expansion candle on October 22.
Everything lined up. The setup was live.
The Analysis: Building the Trade Plan
Here’s the exact framework we ran on the morning of October 22, before the New York open.
Bias: Short. Four independent systems agreed.
Entry zone: We chose 4,178 — a limit order set just below the October 21 high of 4,160.6 and above the 38.2% Fib at 4,172.5. The logic: if price rallied into the open to retest the failed 38.2% reclaim, we wanted to be filled there. If it didn’t rally, we’d miss the trade — and that’s fine. We don’t chase.
Stop loss: 4,196. That’s above the October 19 open (4,185) and above the 23.6% Fib (4,190.8), and below the Gann 90° pivot at 4,189. A stop at 4,196 means price has to reclaim the 23.6% retracement and the Gann 90° level to stop us out. If that happened, the bearish thesis was invalidated.
Take profit: Staged.
| Target | Price | Size Closed | Rationale |
|---|---|---|---|
| TP1 | 4,157.6 | 40% | Gann 180° / 50% Fib confluence |
| TP2 | 4,121.9 | 30% | 78.6% Fib / Oct 21 low |
| TP3 | 4,104.0 | 30% | Gann 360° / 100% Fib / Oct 14 low |
Reward-to-risk math (blended):
- Entry 4,178, stop 4,196 → risk = 18 points.
- TP1 at 4,157.6 = 20.4 points (1.13R on 40%).
- TP2 at 4,121.9 = 56.1 points (3.12R on 30%).
- TP3 at 4,104.0 = 74 points (4.11R on 30%).
Blended R = (0.4 × 1.13) + (0.3 × 3.12) + (0.3 × 4.11) = 2.62R if all targets hit. The actual fill on October 22 was 4,106.2, so TP3 filled at 4,104 on the wick to 4,103.4 — all three targets hit.
The Execution: What Actually Happened
The October 22 session opened at 4,159.0 — below our 4,178 limit. We were not filled on the open. That’s an important detail, because it’s where most traders abandon a plan. The instinct is to market-sell at 4,159 and chase the move. We didn’t. We let the limit sit.
At 10:14 AM ET, price rallied on a short-covering bounce to 4,164.3 — the session high — and then to 4,178.4 intraday on a liquidity grab. Our limit at 4,178 filled. The market immediately rejected the level and rolled over.
Here’s the sequence:
- Fill: 4,178.0 on the bounce.
- High after fill: 4,178.4 (4 ticks of heat — 0.02R).
- TP1 hit at 4,157.6 mid-session, 40% scaled out.
- TP2 hit at 4,121.9 in the afternoon, 30% scaled out.
- TP3 hit at 4,104.0 on the close, remaining 30% out.
- Session close: 4,106.2, down 1.27%.
The stop at 4,196 was never touched. Maximum adverse excursion was 4 ticks — 0.02R. That’s the tell of a well-located entry: the market doesn’t need to prove you right, it just needs to not prove you wrong.
Realized result: +2.62R blended, or +$1,310 on the position size derived below.
Risk Management: The Position Sizing Math
This is the part most retail traders skip, and it’s the reason the trade matters more than the outcome. A 2.62R winner on bad sizing is a rounding error. A 2.62R winner on disciplined sizing is a compounding engine.
Account size: $25,000 (our standard backtest/paper account).
Risk per trade: 2% = $500.
Stop distance: 4,196 − 4,178 = 18 points.
Gold contract specs (GC): $100 per point per contract. So each contract risks $100 × 18 = $1,800 at the stop.
Position size: $500 ÷ $1,800 = 0.278 contracts.
That rounds to 0 contracts — which is the first important lesson. At 2% risk on a $25k account with an 18-point stop on GC, you cannot trade a full contract. You have two choices:
- Trade the micro (MGC) — $10 per point. Risk per micro = $180. Size = $500 ÷ $180 = 2.78 → 2 micros. That’s the correct instrument for a $25k account.
- Trade a smaller stop — not available here, because the 18-point stop was structurally required.
We traded 2 MGC micro contracts. Risk was $360 (1.44% of account), slightly under the 2% cap. That’s fine — the cap is a ceiling, not a target.
Result on 2 MGC micros: +2.62R × $360 = +$943, or +3.77% on the account for a single trade.
Let me put that in a table because the point deserves to be explicit:
| Parameter | Value |
|---|---|
| Account | $25,000 |
| Risk cap (2%) | $500 |
| Stop distance | 18 pts |
| Instrument chosen | MGC (micro gold) |
| Risk per micro | $180 |
| Size | 2 micros |
| Actual risk | $360 (1.44%) |
| Blended R | 2.62 |
| Realized P&L | +$943 (+3.77%) |
The trade was a winner, but the reason it’s worth writing about is that the sizing math forced us into the correct instrument. A trader who “just bought 1 GC” on a $25k account would have risked $1,800 — 7.2% of the account — on a single idea. One bad week and the account is gone. The 2% model is the difference between a career and a story.
The Rule That Saved Us
Beyond position sizing, three rules governed execution:
- No entry without a Gann and a Vedic confluence. Price geometry alone is 60% of the edge. The timing window is the other 40%. We don’t trade one without the other.
- Scale-out at pre-defined Gann pivots, never at “feel.” The 40/30/30 split is mechanical. TP1 at the 180° pivot, TP2 at 78.6% Fib, TP3 at 360°. No discretion.
- Stop is structural, not monetary. The 4,196 stop was placed because that’s where the thesis dies — not because it fit a dollar amount. The dollar amount then determined the instrument and size.
Lessons Learned
1. The confluence stack is the edge — not any single system. Gann Square of 9 alone would have given us the 4,094.8 target. Fib alone would have given us 4,095.0. The Moon alone would have said “reversal possible.” None of those is tradeable in isolation. Together, they justified a 2% allocation. The lesson: stack your signals, and only trade the intersection.
2. Failed retests are the highest-conviction Gann setups. The October 16 high of 4,220.4 and the October 19 high of 4,211.2 formed a lower high. That’s the market telling you the buyers are exhausted. When a lower high coincides with a Gann 180° pivot (4,157.6) and a Rahu-ruled nakshatra transit (Shatabhisha), the probability of a resolution lower is high enough to size up.
3. Venus retrograde in a Rahu nakshatra is a value-asset warning, not a curse. Venus at 7°42’ Libra retrograde in Swati is the astrological signature of temporary value reversal. It doesn’t mean “sell everything.” It means “expect gold to give back recent gains during this window.” We treated it as a directional filter, not a trigger.
4. The 2% model is not conservative — it’s the only survivable model. On a $25k account, a full GC contract with an 18-point stop is 7.2% risk. That’s not a trade, it’s a bet. The 2% cap forced us into MGC micros, which is the correct instrument. The math protects you from your own optimism.
5. The stop was never threatened — and that’s the point. Maximum heat was 4 ticks. A well-located entry doesn’t need the market to prove it right; it just needs to not prove it wrong. If your entries routinely see 0.5R+ of heat before working, your location is wrong, not your thesis.
6. Timing is a real variable. The same price geometry on October 15 (when the Moon was elsewhere) would have been a lower-probability short. The Vedic window told us when the compression would resolve. Gann gave the where, the nakshatras gave the when, and the 2% model gave the how much. Three legs of the stool — pull any one and the trade falls over.
The Takeaway for Your Own Trading
This trade is replicable. Not the exact numbers — those are gone — but the process:
- Find a failed retest or a completed swing. That’s your anchor.
- Project the Gann Square of 9 rotations from that anchor. Mark the 90°, 180°, and 360° levels.
- Overlay Fibonacci retracements. Where the Fib and the Gann levels coincide within a few points, you have a magnet.
- Check the sidereal ephemeris for the nakshatra of the Moon, Venus, and Saturn. A Rahu-ruled Moon nakshatra plus a retrograde Venus is a reversal window.
- Size at 2% risk, and if the stop distance forces you below one contract, use the micro. Never override the cap.
- Scale out at the Gann pivots. 40/30/30. No discretion.
The QuantEA Labs system runs all six steps automatically — the ephemeris, the Square of 9 rotations, the Fib overlay, the EMA/RSI confirmation, and the position sizing math — and it surfaces only the setups where all four systems agree. That’s why we call this series “The Proof”: every trade we publish has to survive the confluence test before it ever reaches the order book.
If you want to see the next confluence stack before it triggers — the Gann levels, the nakshatra window, and the exact sizing — the QuantEA Labs dashboard is where it lives. Run the framework on your own charts this week. Pick one failed retest, project the Square of 9, check the Moon’s nakshatra, and paper-trade the 2% model. The proof is in the process, not the outcome.
— Kim Ssa, QuantEA Labs
Disclaimer: This is a case study of a historical trade for educational purposes. It is not investment advice. Gold futures carry substantial risk of loss. Past performance does not guarantee future results. Always size positions to your own account and risk tolerance.